In this project, we analyse the data set representing multi-channel sales campaigns and sales of a gifts company to gain insights into the effectiveness of the various direct-marketing channels – specifically catalog mailing v.s. email. The data set is splitted into two parts to validate all our data-based targeting remmendations below. The point of this splitting is to mimic a sample mailing(which realistically we cannot do). Details of our analysis are shown below:
Section A - Interesting analytical questions
We raised two interesting analytical questions we can ask the data, and study the data to give answers.
- Compare the order methods for response order by different contact type.
- Compare the average & total response order spend by different contact type.
Section B - RFM segmentation and Campaign ROI
We segmented data using the RFM dimensions(5 quantiles for each dimension). Then estimated response rates for each RFM cell and made a decision on how many to mail. Lastly, we validated it on a sample mailing to calculate ROI of the campaign.
- Exploring Data
- Splitting Data
- RFM segmentation
- Sample Mailing
Section C - Add Another Dimension to Target
We chose another dimension to add to target and justified our choice based on business/common-sense and data.
- Additional Dimensions
- New Segmentation
- Sample Mailing
Section D - Conclusion and Recommendation
Section E - Limitations and Ideas for Improvements
Brief Introduction of the Dataset (by Richard J. Courtheoux)
A multichannel company with sales of several hundred million dollars per year has provided the Direct Marketing Educational Foundation with a dataset that can be used for classroom teaching. The company has a network of retail stores, a well-established traditional catalog channel and a website. Its brand is very well known nationally and it has a strong positive reputation along with very good long term customer loyalty. The core of the company’s business consists of food products which are often purchased as gifts during the Christmas season. Their marketing challenges include:
- Customer relationship management, including contact management, across multiple channels.
- A very competitive marketplace for Christmas season gifts.
- Generating business during the non-Christmas months of the year.
The DMEF dataset consists of 4 files that have been extracted from the company’s marketing database and that can be linked based on customer ID numbers. The files are:
- 100,051 customer records that have a customer ID, buying activity summarized by channel for 8 seasons, channel summary Recency/Frequency/Monetary information prior to the 8 seasons, gift recipients counts by season, catalog and e-mail circulation counts by season for 6 seasons, first order characteristics, overlay demographic and psychographic data, estimated distance to a retail store and the sectional center code (i.e., the first 3 digits of the customer’s ZIPCode).
- 3,389,329 marketing contact records. These include both catalog and e-mail contacts with data fields containing the customer ID, the contact date and the type of contact. The records cover the years 2005 – 2007.
- 241,366 order or store trip records. Each of these records has a customer ID, an order number, date, channel and payment method. The records cover the years 2001 - 2007.
- 618,661 line item records. These records have a customer ID, an order number, date, price, a gift flag and (if applicable) the ID of the gift recipient. These records also cover the period from 2001 - 2007.
Section A - Interesting analytical questions
A.1 Compare the response order methods of different contact types
In the following analysis, an order within 7 days of a contact will be recognized as a response order.
Explanation
Join the ‘orders’ table with ‘contacts’ table by ‘cust_id’. Select the ‘orderdate’ and ‘contactdate’ from the joint table. Filter the response order by calculating the difference of ‘orderdate’ and ‘contactdate’. Count the ‘ordermethod’ and Group by ‘ordermethod’ and ‘contacttype’.
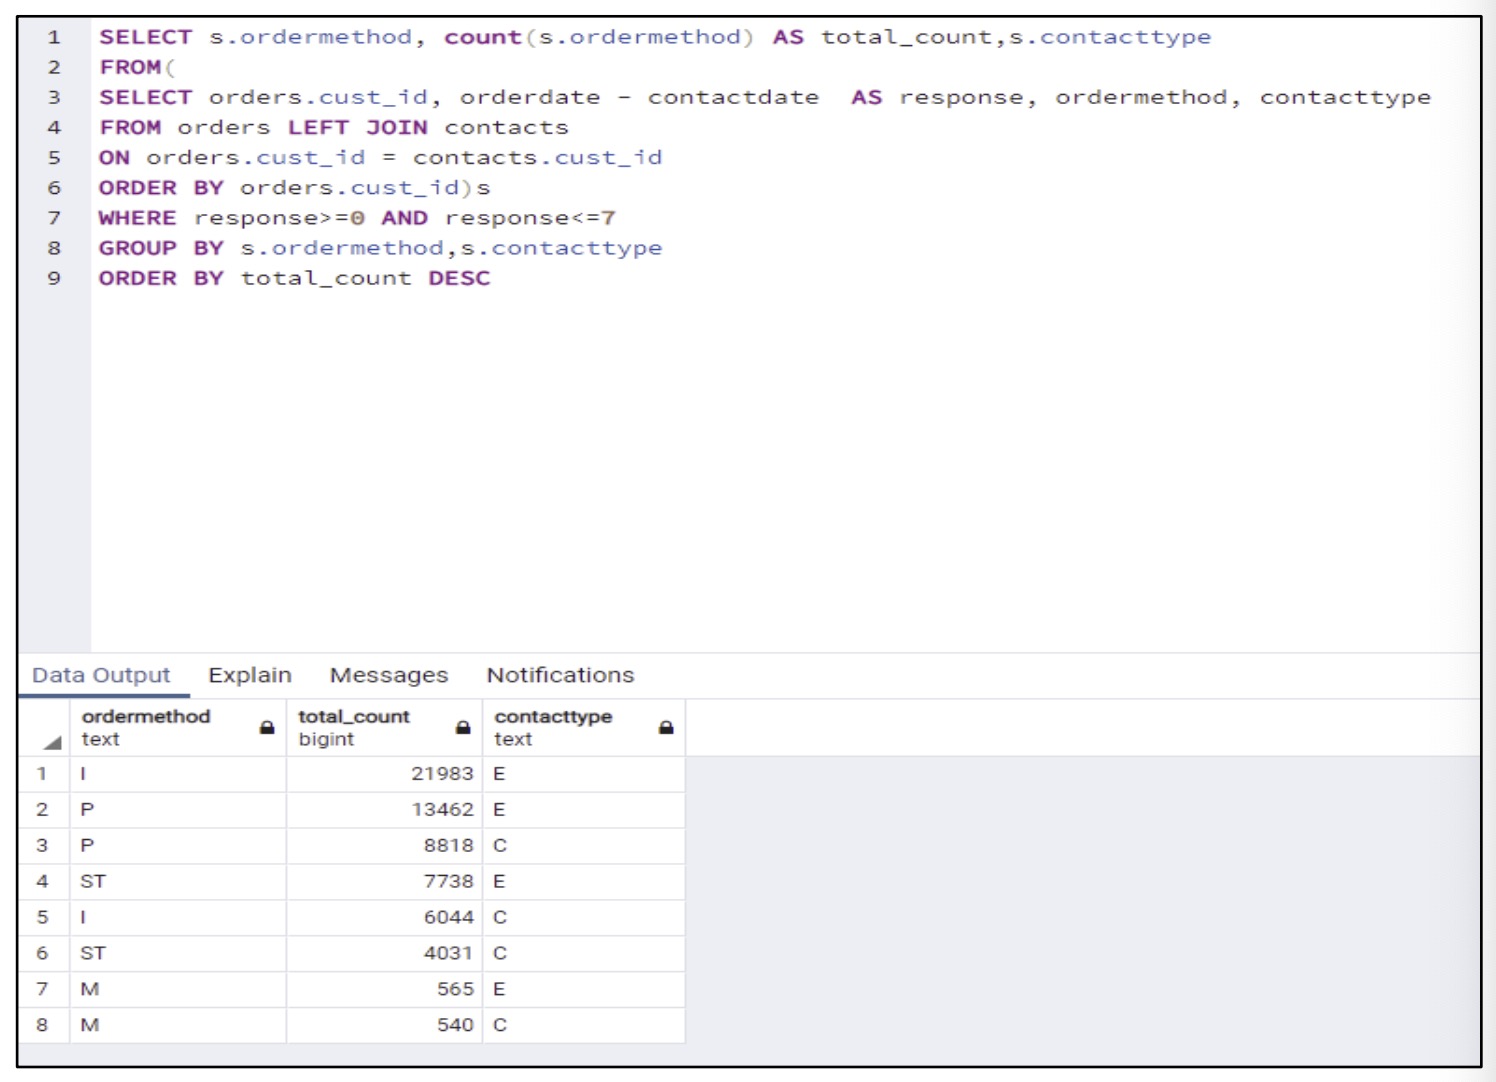
Observation
From the results, we can find overall the email contact channel have more response orders than catalog mailing contact channel. The highest order method of email contact is Internet and the highest order method of catalog mailing contact is Phone. Overall, the Internet and Phone is the top two order method for both email contact and catalog mailing contact.
Recommendation
Taking the insight above, the gift company could design the marketing channels material, e.g. emails, catalogs according to the order method preference. For example, easier access (or link) to the internet order sites via emails, more visible internet order methods and phone contacts in marketing channels. With high orders made by phone, the gift company could also review the phone order services provided to ensure customers are satisfactorily-engaged and proceed with orders.
A.2 Compare the average & total response order spendings of different contact types
Explanation
Join the ‘orders’ table with ‘contacts’ table by ‘cust_id’. Select the ‘orderdate’ and ‘contactdate’ from joint table. Filter the response order by calculate the difference of ‘orderdate’ and ‘contactdate’. Join this temporary table with ‘lines’ table by ‘ordernum’. Calculate the average and total response spending by AVG() & SUM() function. Group by ‘cantacttype’.
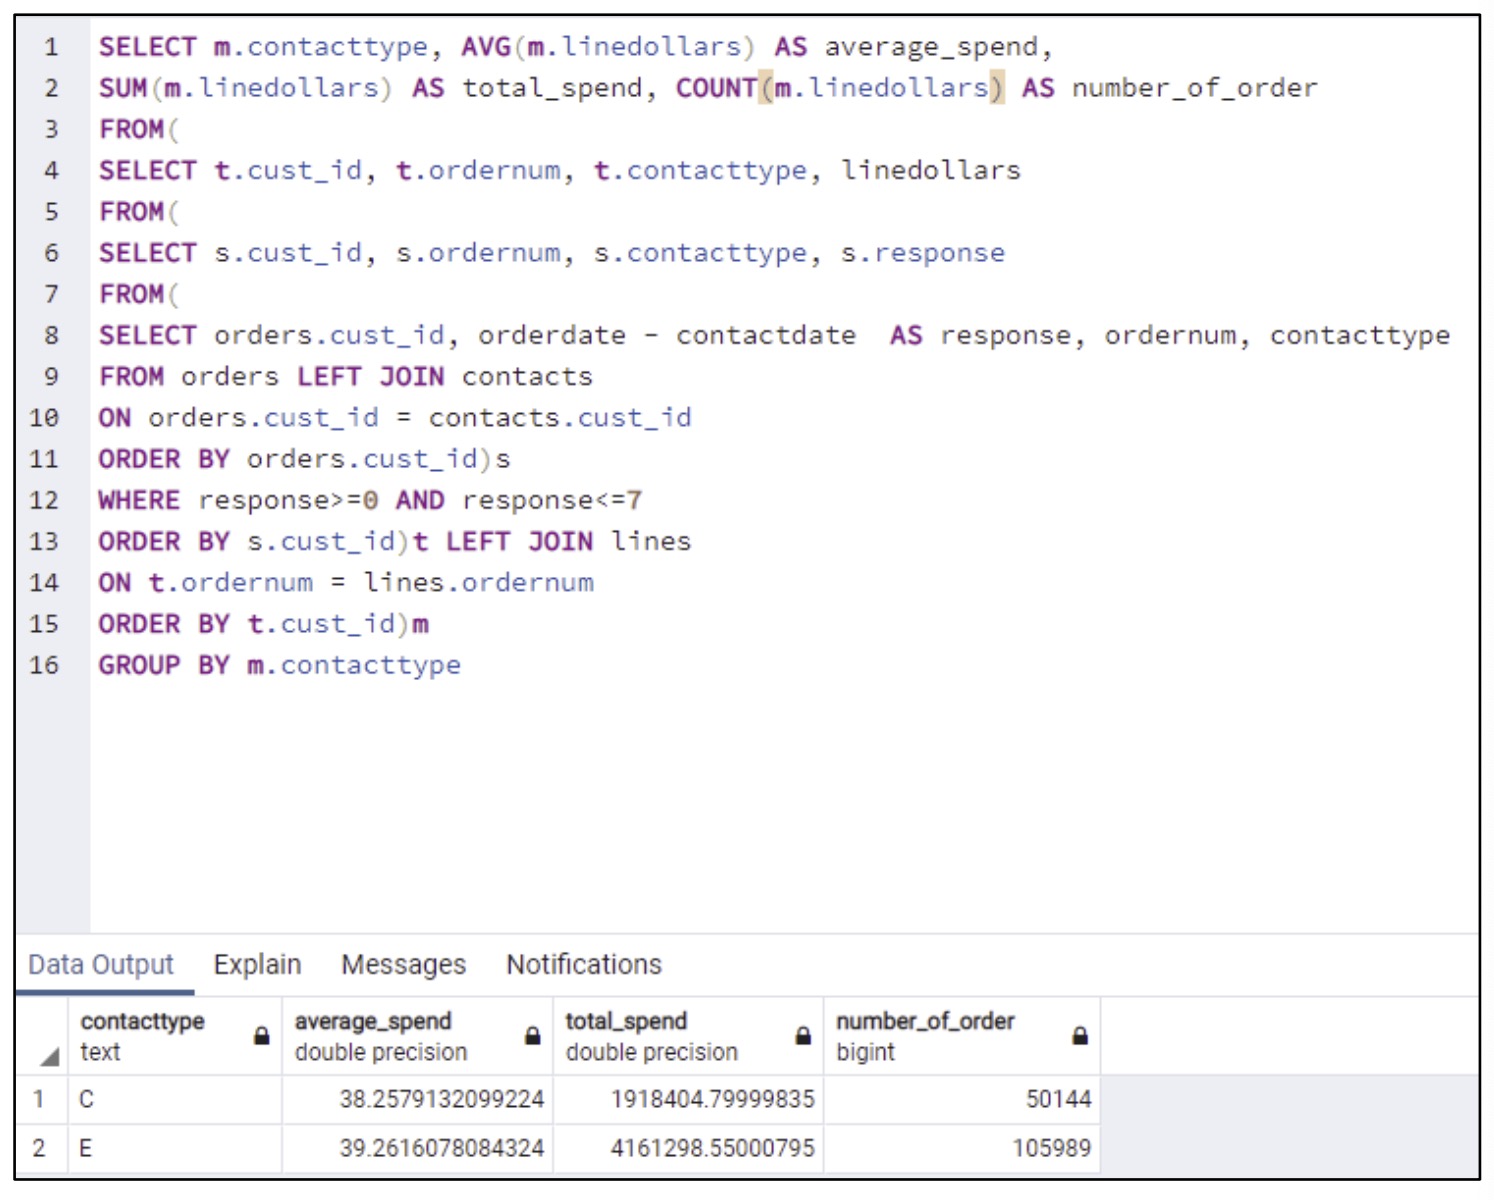
Observation
From the results, we can find the average response spending for both contact types are very close, it’s $38.26 for catalog mailing and $39.26 for email. Email channel shows slightly higher average response spending than the catalog mailing.
However, in the total response spending, the email channel is much higher than the catalog mailing, which is $4.16 million for email but only $1.92 million for catalog mailing. This is due to the number of response order by email is over twice than the number of response order by catalog mailing channel.
Recommendation
Base on this result, we suggest company to increase the contact time with customers by email since it shows higher revenue and lower contact cost comparing with catalog mailing.
Section B - RFM segmentation and Campaign ROI
B.1 Exploring Data
There are a total of 100,051 customer records in the customer database.
Table ‘contacts’:
- with the earliest contact made on 6th January 2005, and the last contact made on 26th December 2007, involving only 80,421 customers (or 80.4% of the total customers in the database).
Table ‘orders’:
- with the earliest order made on 1st January 2001, and the last order made on 1st January 2008.
- 1,260 customers (or 1.2% of the total customers in the database) that had made purchases before year 2005 (start of contact year) have remained receiving no contacts at all despite continue making purchases in year 2005 and onwards.
- 7,097 customers (or 7.1% of the total customers in the database) that had made last purchases before year 2005 (start of contact year) had received no contact at all. Contrary, and surprisingly, 27,222 customers (or 27.2% of the total customers in the database) that had made last purchases before year 2005 still received contact year 2005 and onwards.
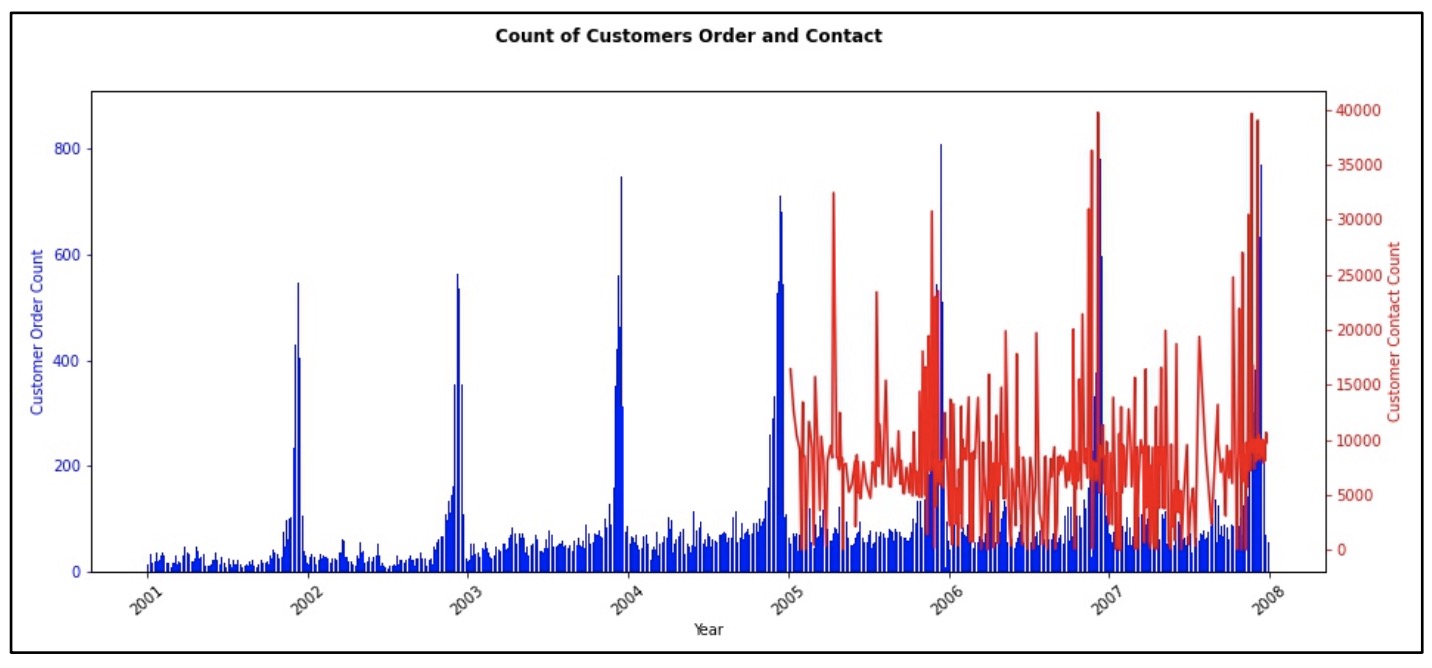
The following diagram shows the count of orders and contact from the customer database obtained.
The following diagram shows the same plot as above, but zoom in further for period year 2005 to year 2008.
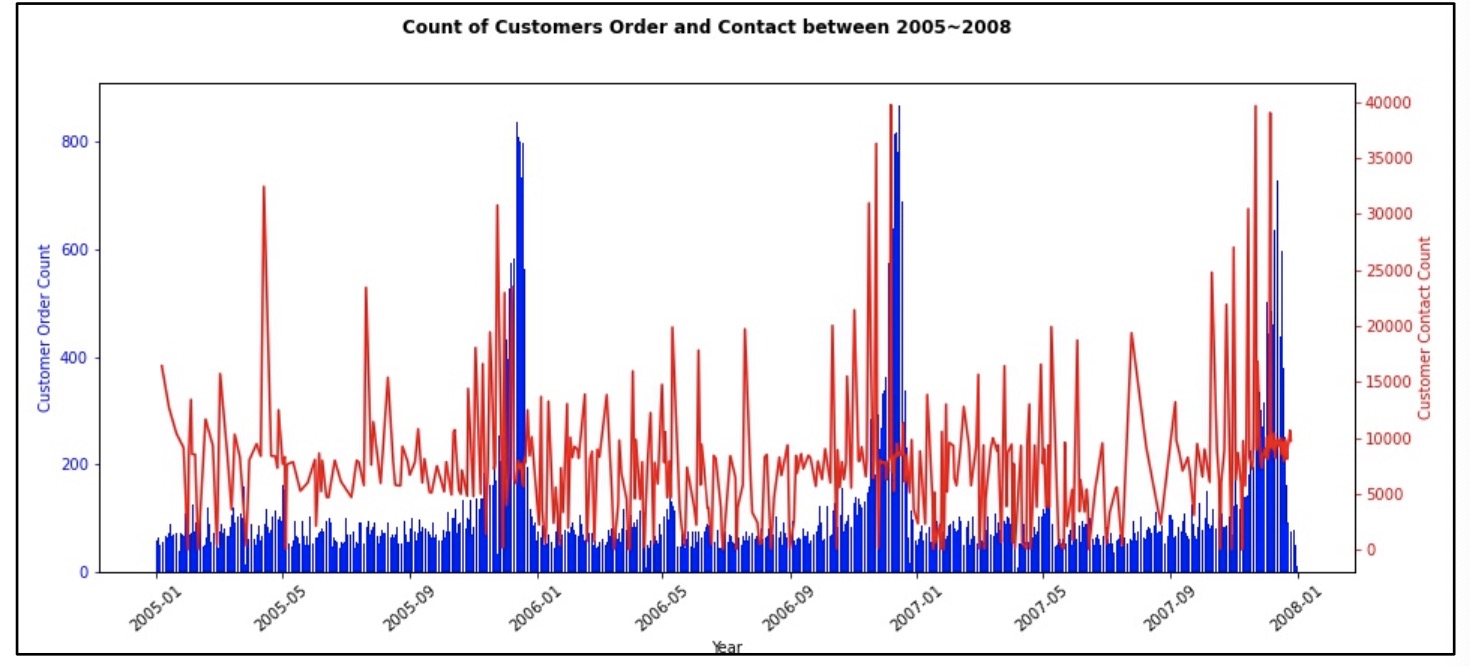
It is observed from the above diagrams that,
- Orders from customers followed a cyclic pattern, with a spike of orders in the month of November-December every year.
- Contacts made to customers peaked in the month of October-November, while there were several spike in non-Christmas season, explaining the effort by the company on their marketing to boost non-Christmas sales.
Trying to understand how contacts were made, we plotted graph showing contact type and number of contacts made against time period (year 2005 to year 2007). The following diagram shows contact type between year 2005 and year 2007.
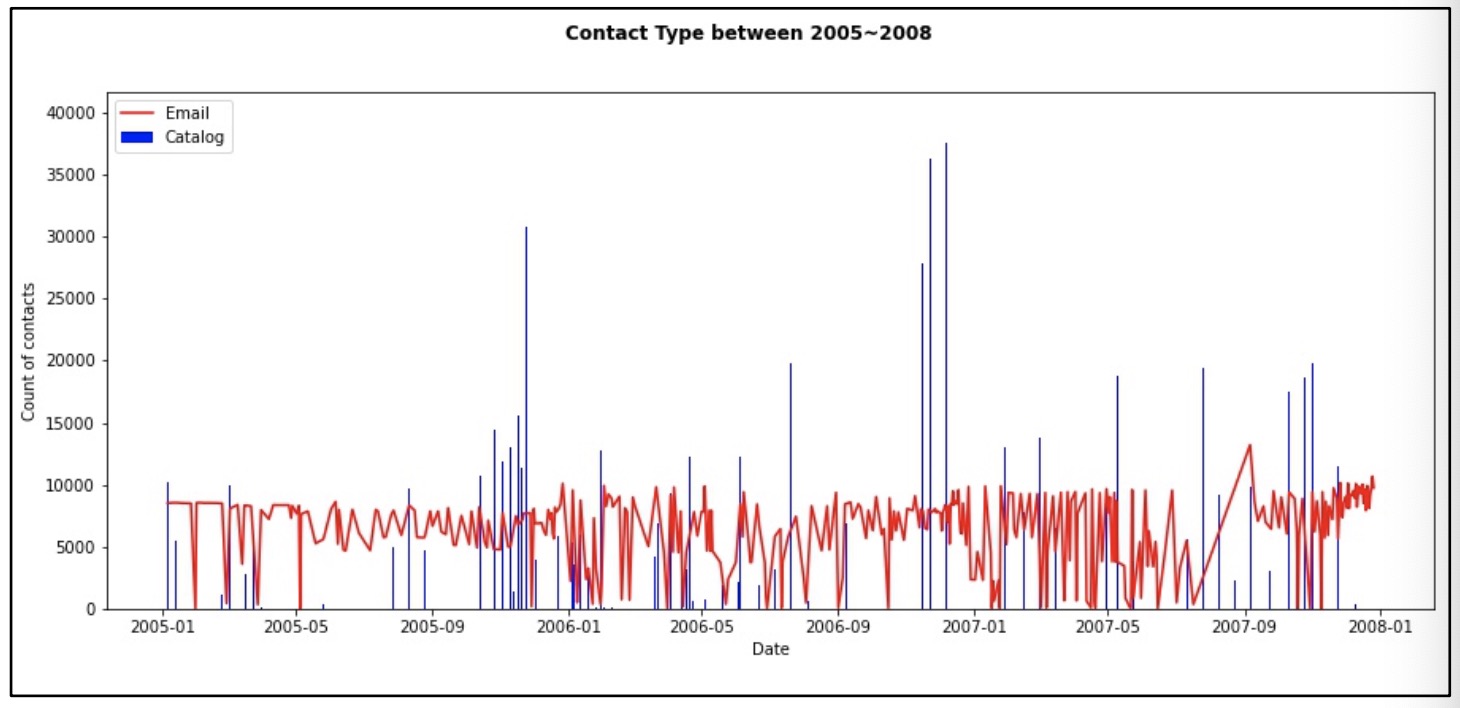
Emails were sent more frequently throughout the year, with each emails campaign sending around 1,000 to 10,000 customers. On the contrary, catalogs were sent with a longer interval, though with a higher frequency and bigger pool of customers targeted in the last quarter of every year.
Another observation that we noticed, there were short time overlaps between emails and catalogs to the same customer. Emails and catalogs were not segregated among customers, but the same customers could receive both emails and catalogs. This brings difficulty in segregating the real response of order made against the marketing channels effect.
B.2 Splitting Data
While we could not determine why there were 1260 customers have not been contacted by the company in their marketing channels, and discrepancies for contacts made to those customers making last purchase before year 2005; we have taken the approach by splitting the customers by two groups according to date:
- Group 1: customers, and orders made before 1st January 2007
- Group 2: customers, and orders made on 1st January 2007 and onwards
We will use Group 1 for RFM segmentation, and use Group 2 data to determine the response rate of contacts made.
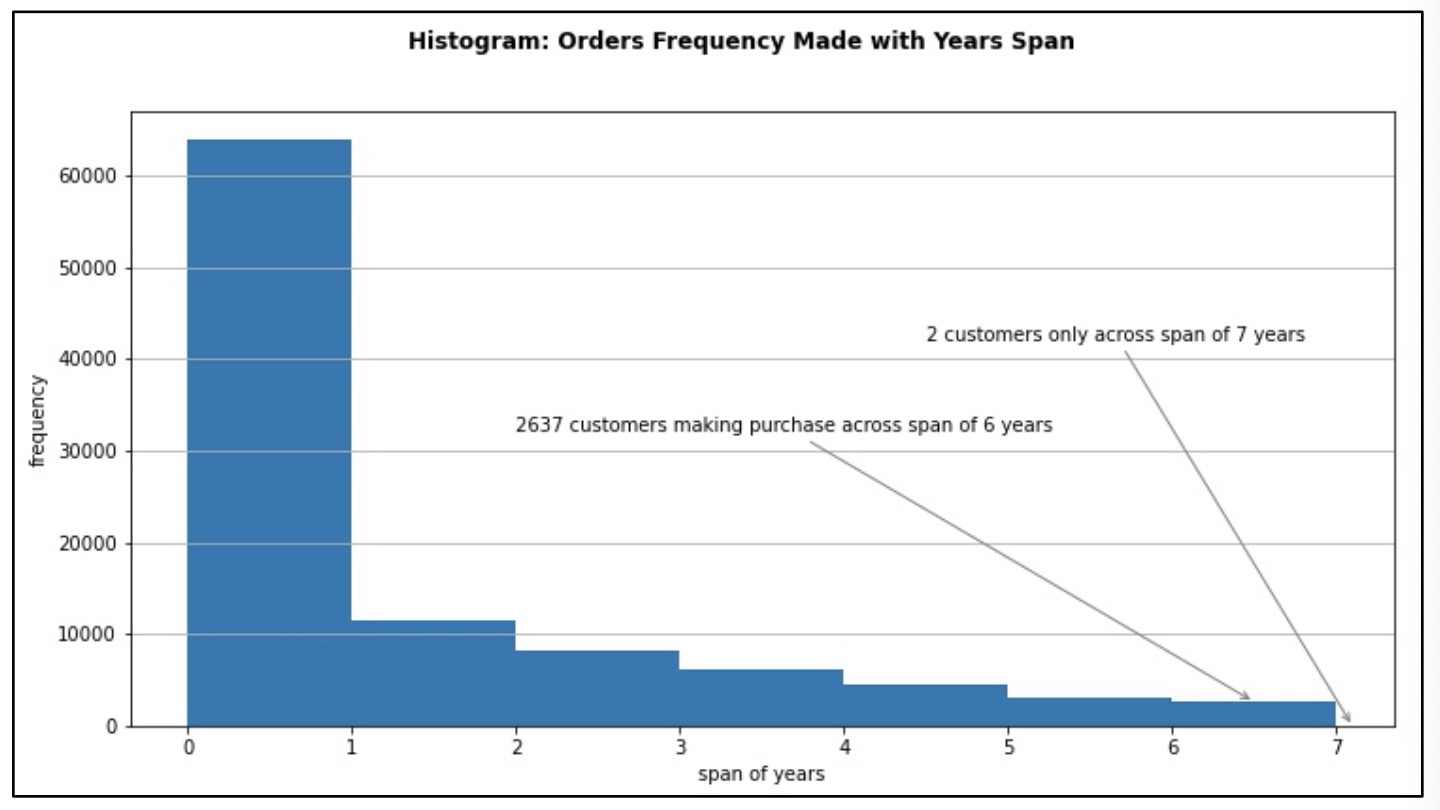
In Group 1 data, we have included the first order since year 2001, and did not omit any customers order record since day 1 for customers segmentation using Recency-Frequency-Monetory (RFM) Model. From data exploratory analysis, we found customers who were still making purchases from early years till year 2007, though we have observed also that most customers made purchases within one year only. Since we have not done detail churn analysis, we include all customer records since year 2001 into Group 1 data.
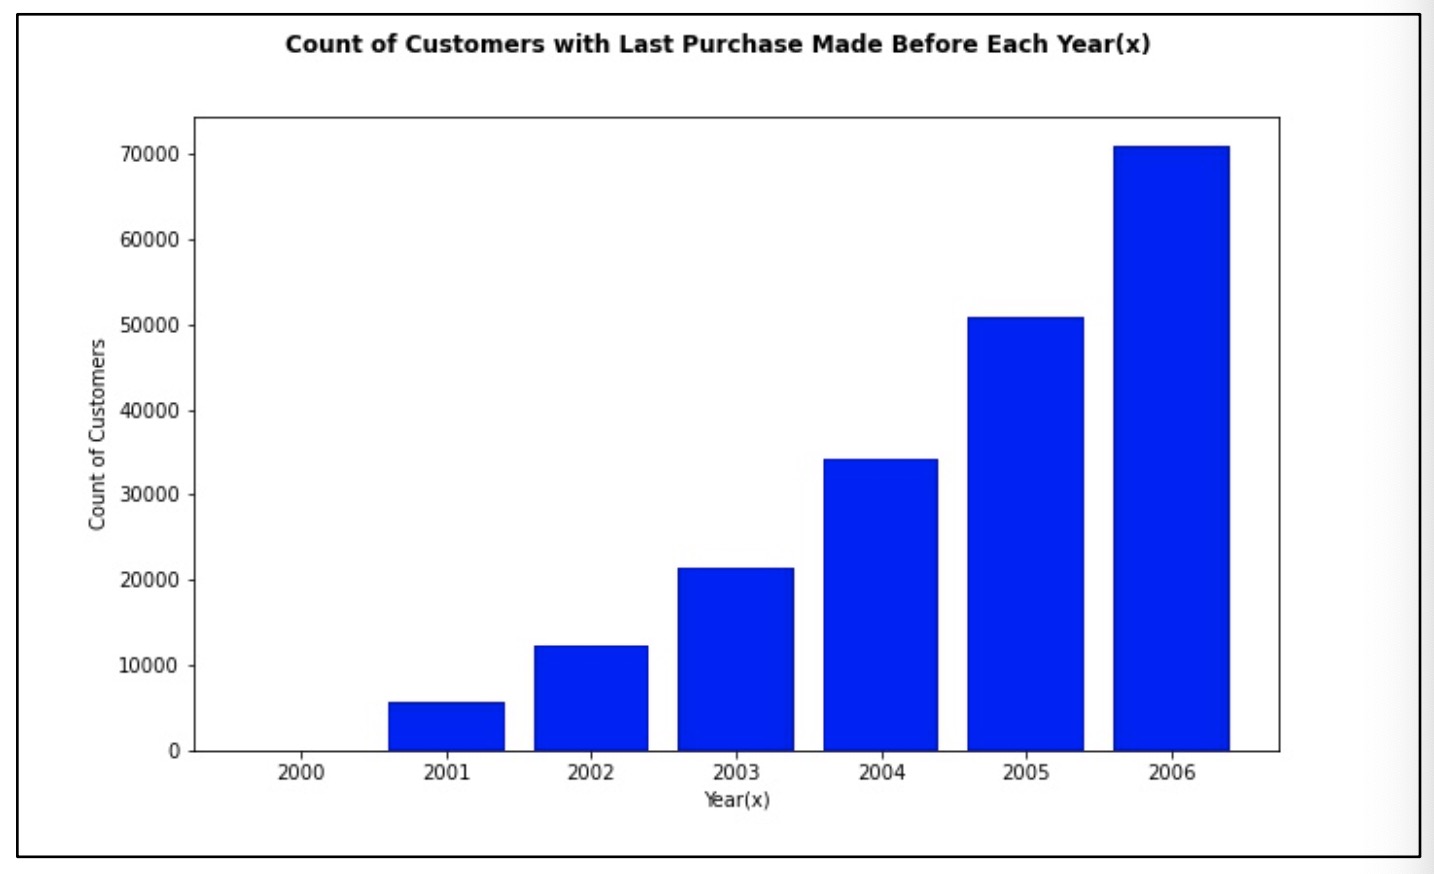
The following diagram shows the count of customers that made last purchase at each year.
The following diagram shows the orders frequency against orders made with span of years.
While there has been increasing ‘churn’ trend since year 2001, there were customers who had made last purchase in early years, but still exists in the customers database as described earlier, and stayed in the contacts list. We have also noticed that there were customers who still purchase continuously till year 2007.
With these observations, we will keep all records in the customers database for segmentation purpose. We do not discard the customers who made last purchase in early years as there could be customers returning in future.
For Group 2 data, we will use it to calculate response rate in determining the segment that will provide the best profit and hence the Return-of-Investment (ROI). We use the contacts data in year 2007 to calculate the order response to contacts made in year 2007, in mirroring the sample mailing in actual. In practice, sample mailing will involve typically 3% of the customers in each segment in a random manner. However, for this study, since there will be no sample mailing involve, we assume all contacts made in 2007 as the sample mailing since data of contacts and orders are readily available.
B.3 RFM Segmentation
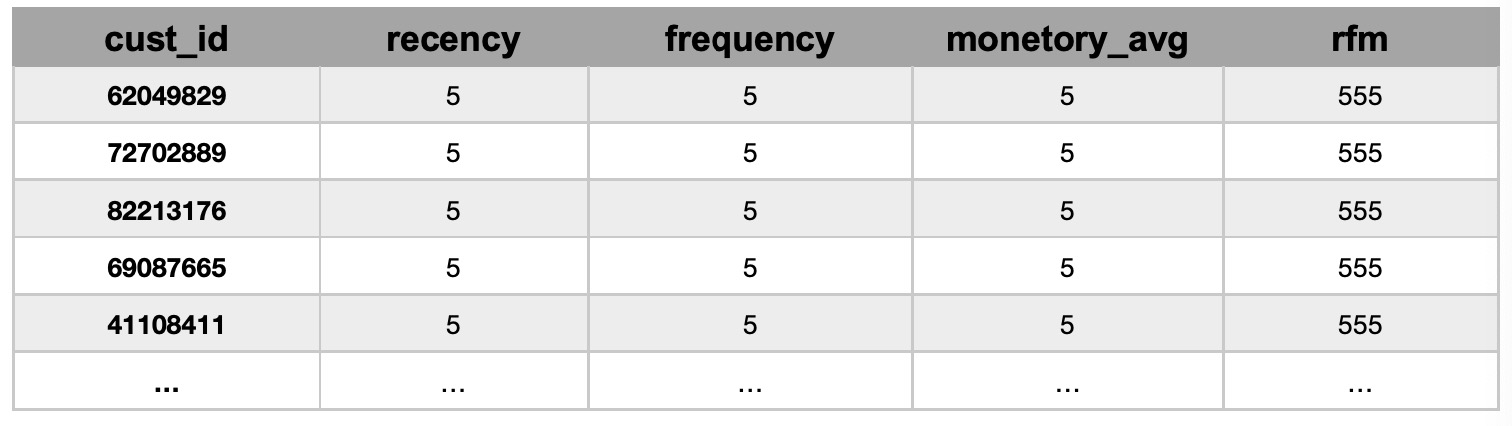
We will set 5 quintiles for each dimension, so there will be 125 stratums in total.
- Recency(R): we sort customers by their last purchase date. Setting the most recent 20% as 5, and the least recent 20% as 1.
- Frequency(F): we sort customers by their average count of purchase made throughout their stay (total number of years span, for example, first purchase made in year 2003, last purchase made in year 2006, will be a span of 4 years) with the gift company, that is total count of purchase divide by total span of years. Setting the top 20% highest average count of purchase as 5, and the least 20% as 1.
- Monetary(M): we sort customers by their average purchase amount, that is the sum of purchases (dollars) divided by the total count of order. Setting the top 20% average purchase amount as 5, and the least 20% as 1.
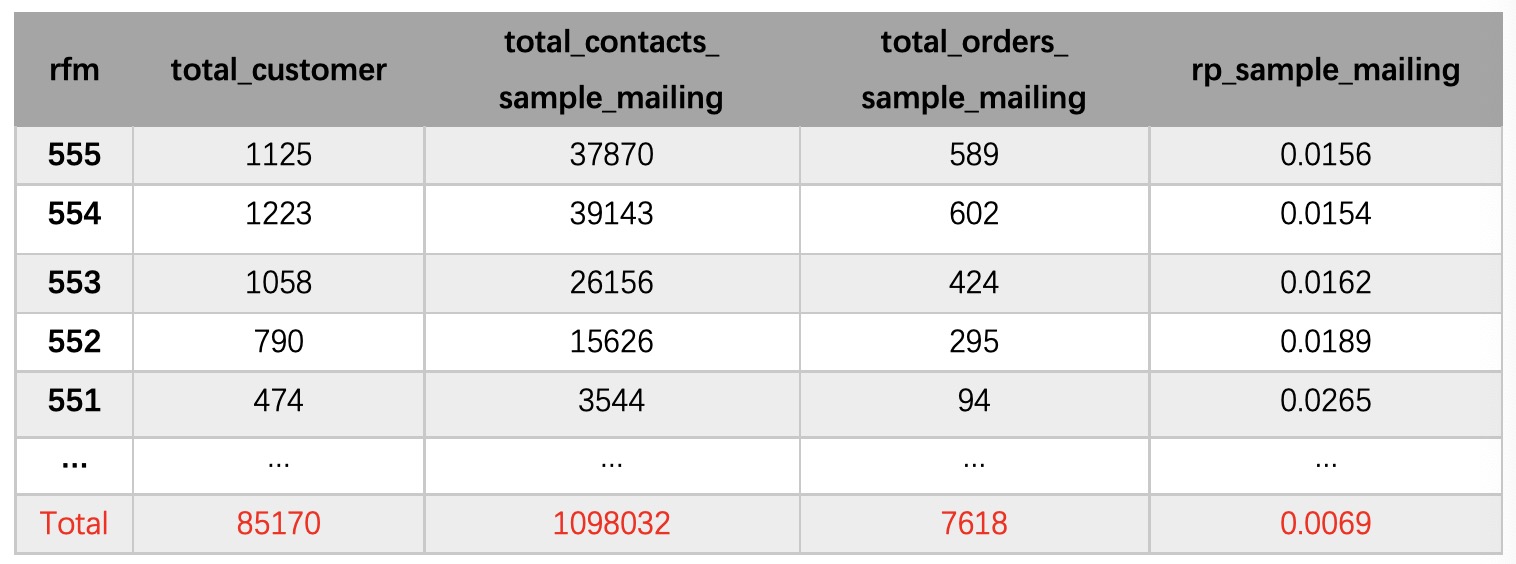
A brief version of the RFM segmentation table is showed below.
B.4 Sample Mailing
As described in B.1 above on the difficulty in segregating the real order response to marketing channels effect (e.g. emails, catalogs), and there is no cost information provided to differentiate each type of marketing channels, we take the approach of studying the response rate of marketing channels in general.
Here we have the contacts and orders information in 2007 to mimic a sample mailing. We have considered two ways to estimate the response rate which we define as simple response rate and effective response rate. The difference between these two methods is how many orders in total we have taken into account for our calculation of response rate.
According to the materials we get, we assumes that it costs a normalized $1 per mailing and an average profit of $30 per purchase.
(i) Simple Response Rate
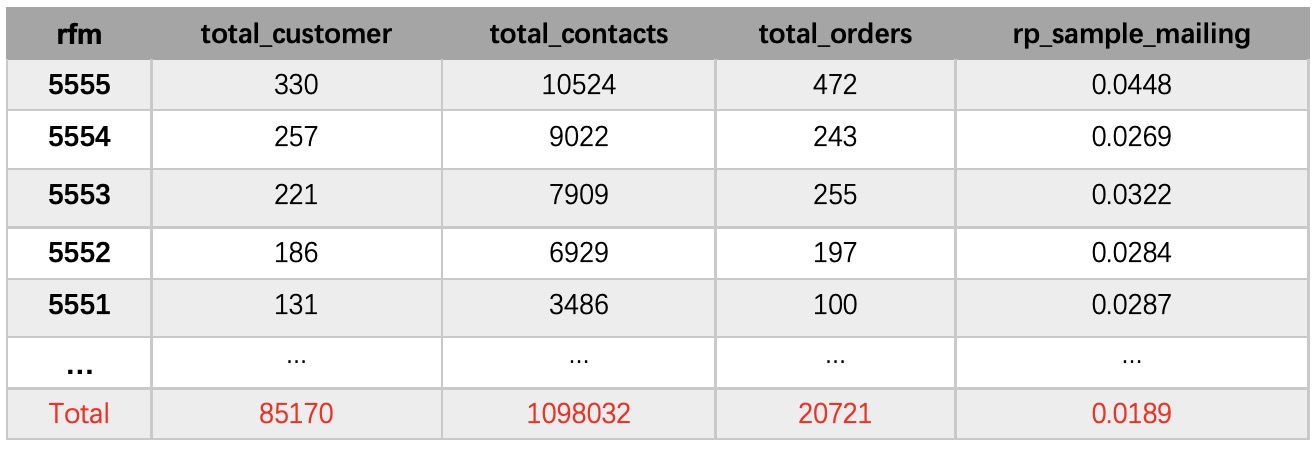
In this case, we will count how many times we contact each customer and how many times a customer purchases during the year 2007 despite the contact date and order date. Next, we will calculate how many contacts we make in total and how many orders in total for each RFM stratum. Then we can get the response rate of sample mailing for each RFM stratum by (orders in total for each stratum) / (contacts in total for each stratum).
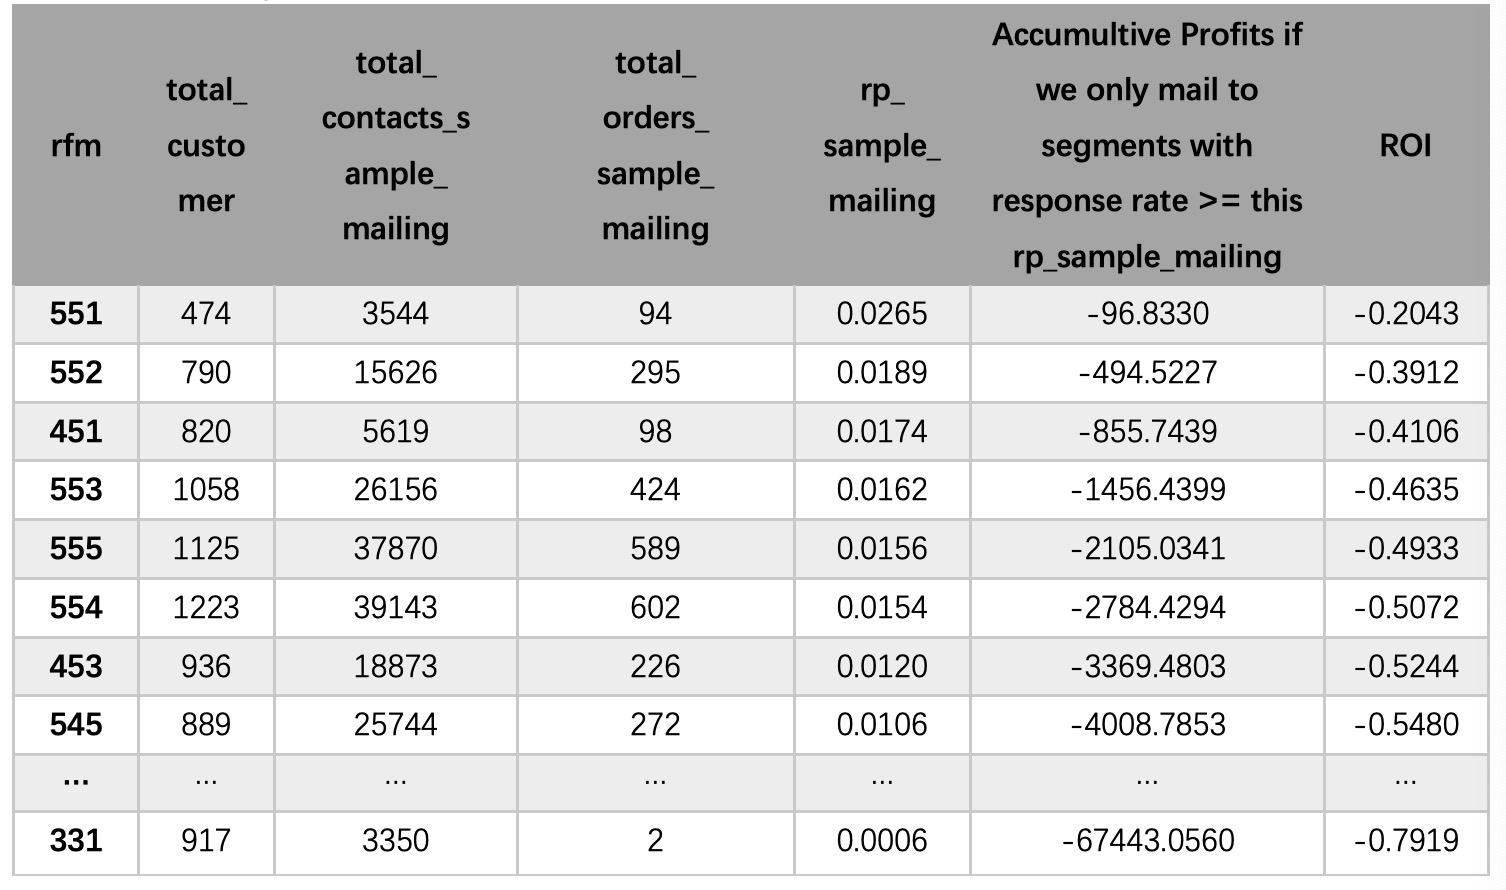
An overview of this sample mailing is showed below:
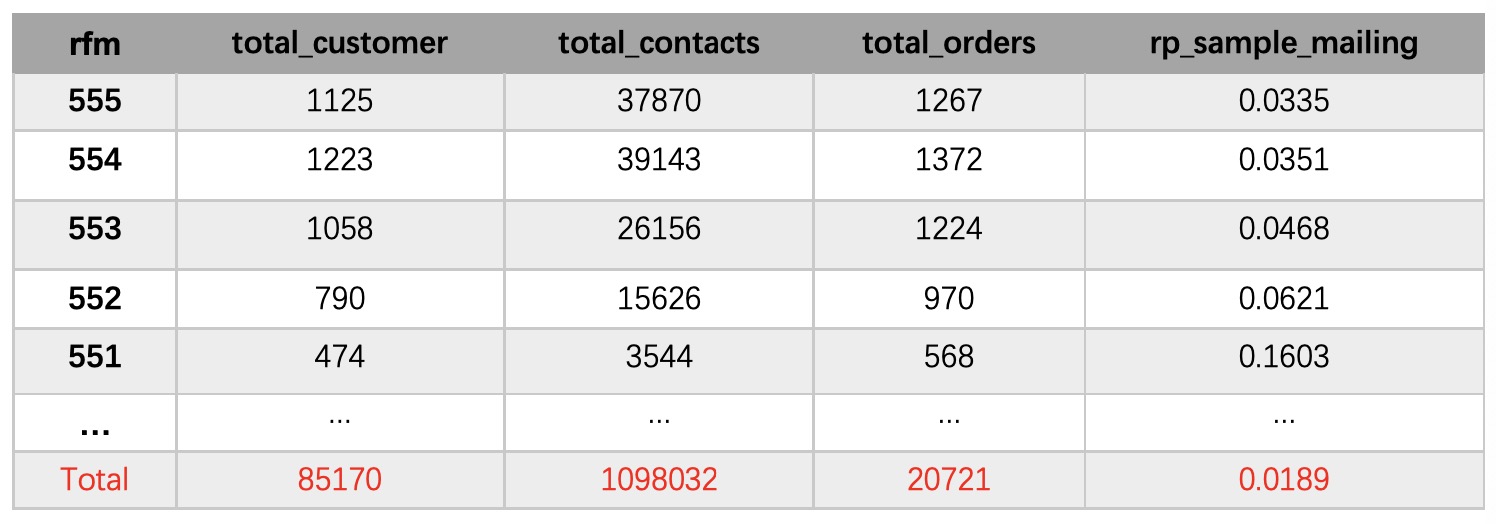
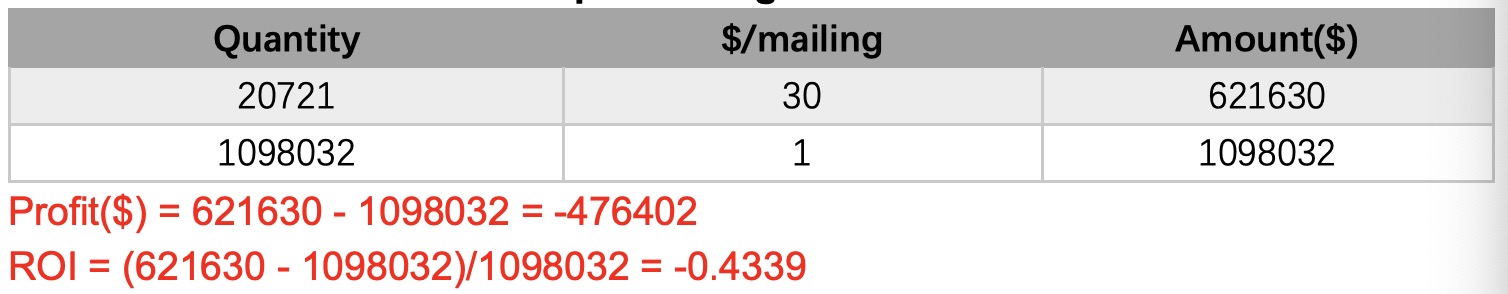
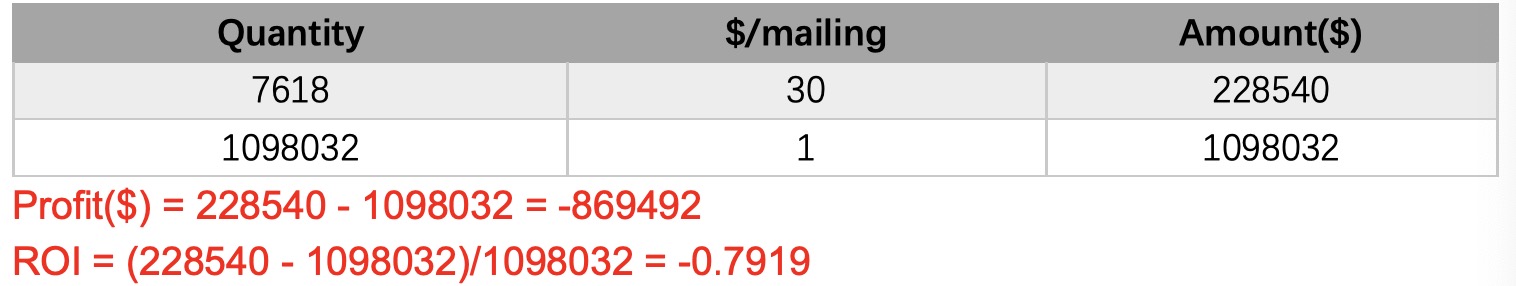
With net profit of item sold = $30 and the mailing cost per mail = $1, we can calculate the profits and ROI.
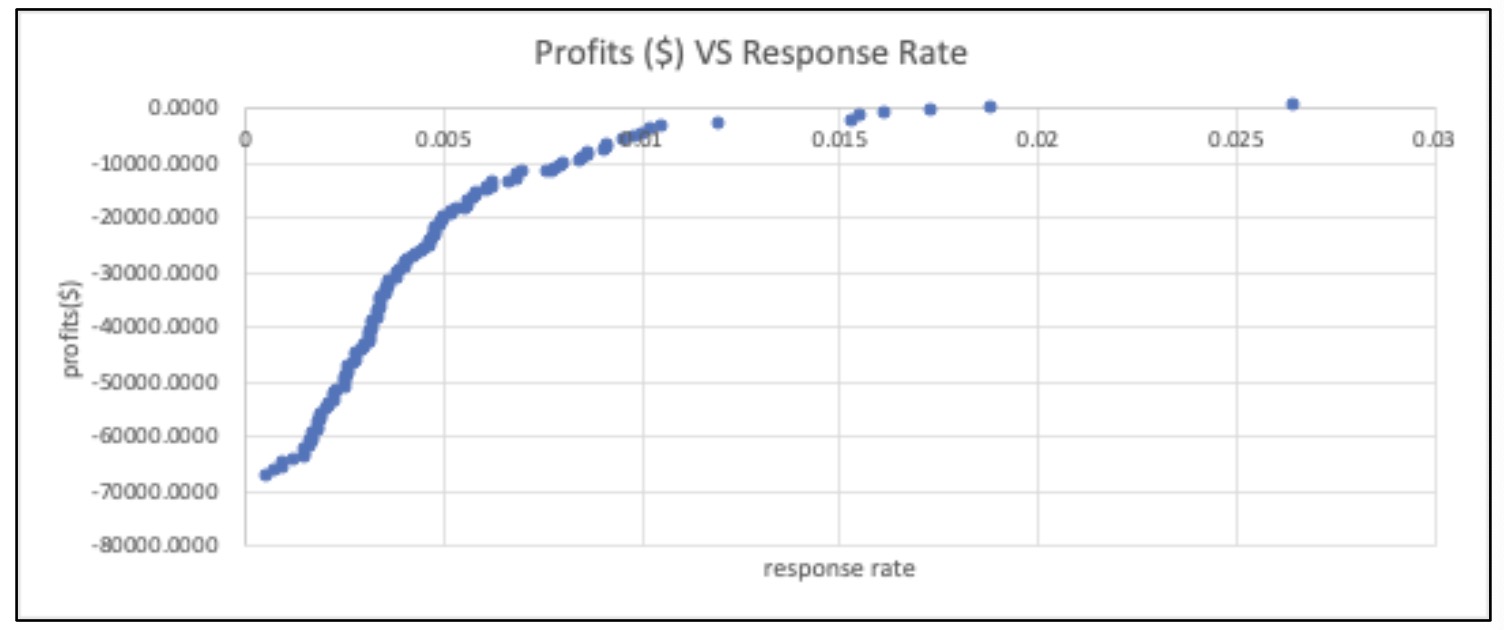
- Profits and ROI of the sample mailing
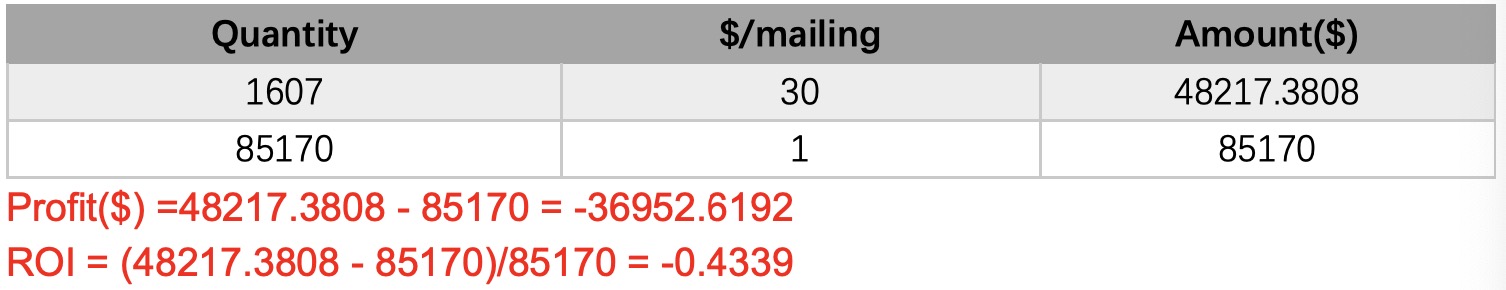
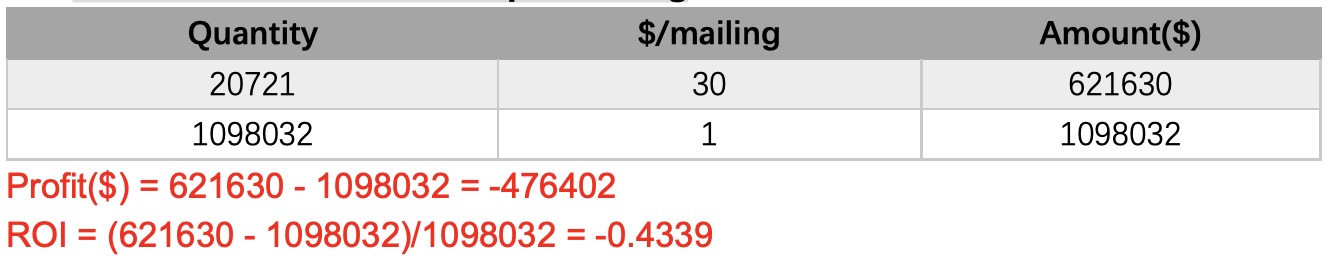
- Profits and ROI if we mail all the customers once
We have 85170 customers in total , and the response rate is 1.89%, so we can expect about 1607 responses.
We can see that if we mail to every customer, we will face negative profits and ROI. So we need to find a baseline response rate. If we only mail to RFM segments with response rates higher than this baseline response rate, we can maximize our profits.
- How many to mail
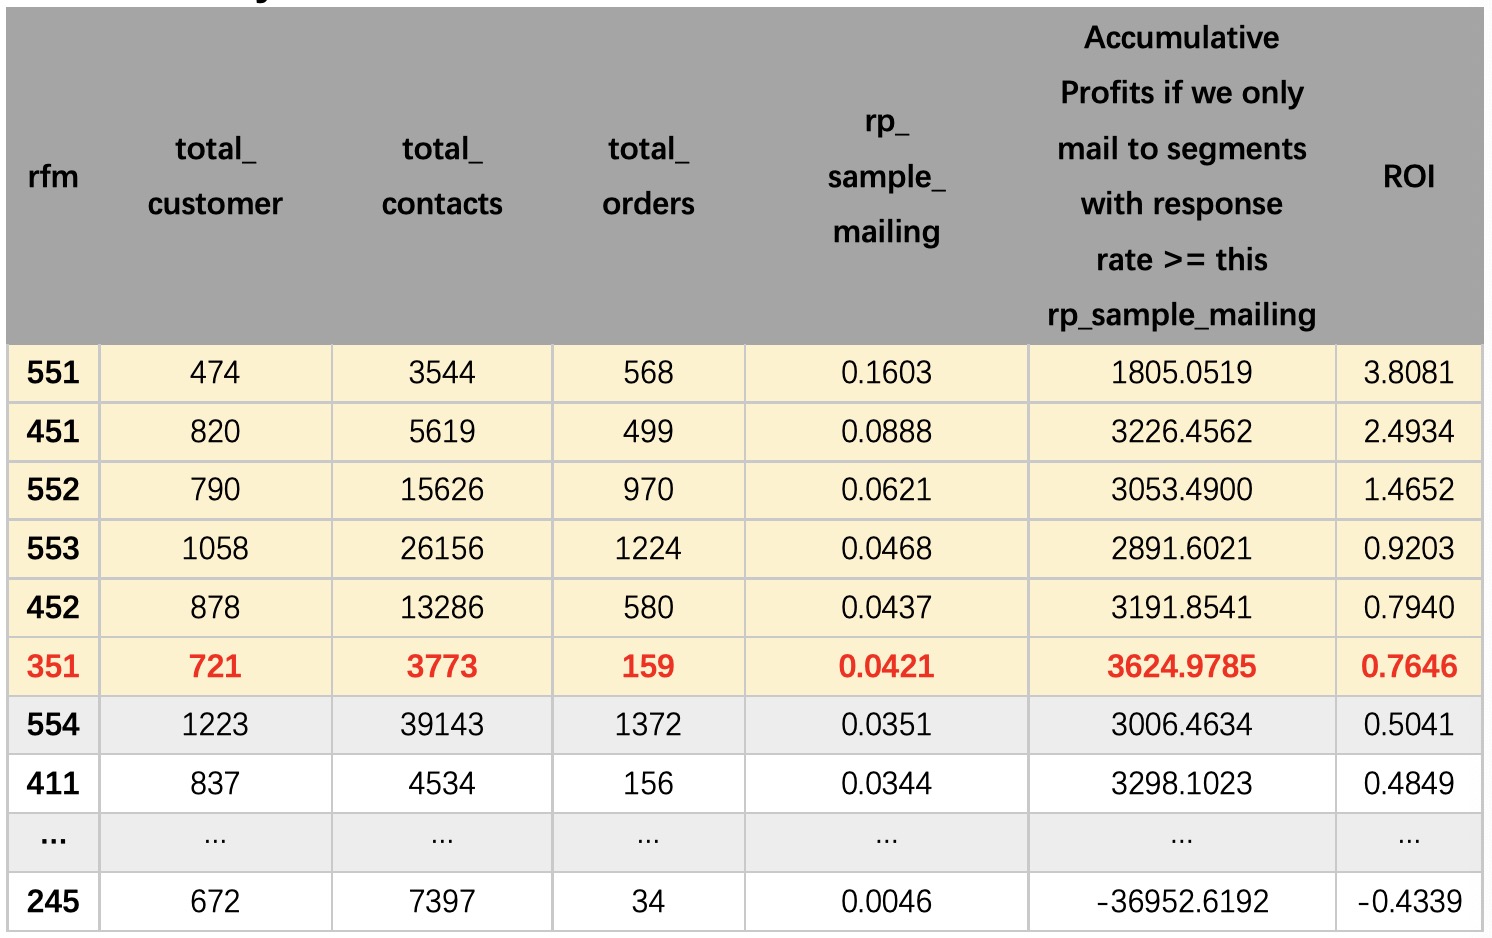
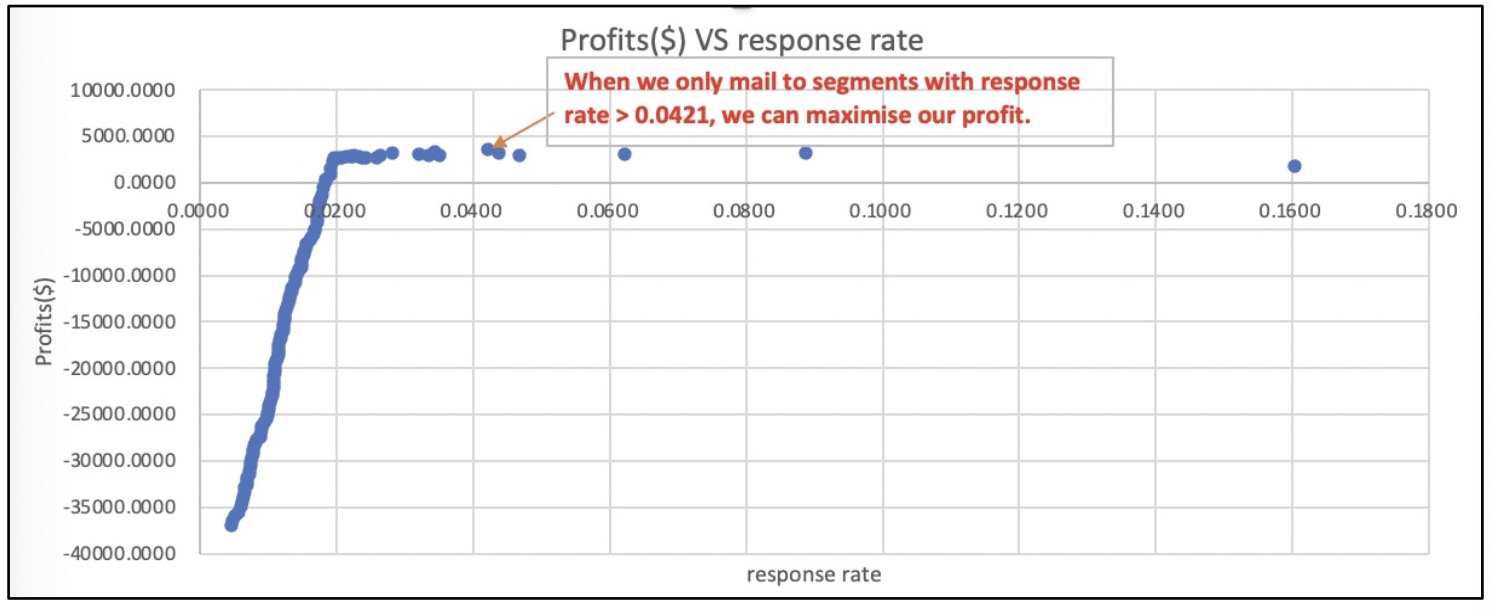
We can see that if we only mail to those segments with response rates higher than 4.21%, we can maximize our profit. It is 6 segments(4741 customers) in total and expected response rate is sum(568,499,…,159)/sum(3544,5619,…,3773) = 0.0588. So if we mail to everyone in these segments, we expect roughly 5.88% × 4741 =279 responses. The profit will be about 27930 - 47411 = 3629. The ROI is about (27930 - 47411)/ 4741*1 = 0.76.
However, there may be an over-estimate bias in this simple response rate calculation. Since we don’t consider the contact date and order date in this case (what we only care about is the total number of orders and contacts), there may be cases that the order dates are before the contact date which should not be considered as a reply to our mailing. Therefore, we have tried another way to estimate the response rate by taking the contact date and order date into consideration.
(ii) Effective Response Rate
In this case, we assume an effective response period as one week(7 days), which means orders that are made within 7 days after the contact will be deemed to be effective orders. Next, we will calculate how many contacts we make in total and how many effective orders in total for each RFM stratum. Then we can get the response rate of sample mailing for each RFM stratum by (effective orders in total for each stratum) / (contacts in total for each stratum).
An overview of this sample mailing is showed below:
Comparing to the simple response rate case, we can see that the total orders are much less, and the overall response rate of sample mailing is lower in the effective response rate case.
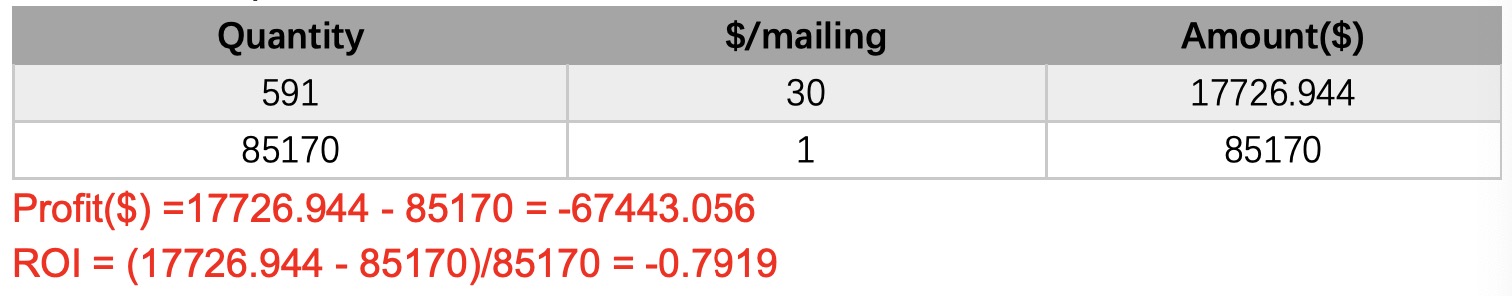
With net profit of item sold = $30 and the mailing cost per mail = $1, we can calculate the profits and ROI.
- Profits and ROI of the sample mailing
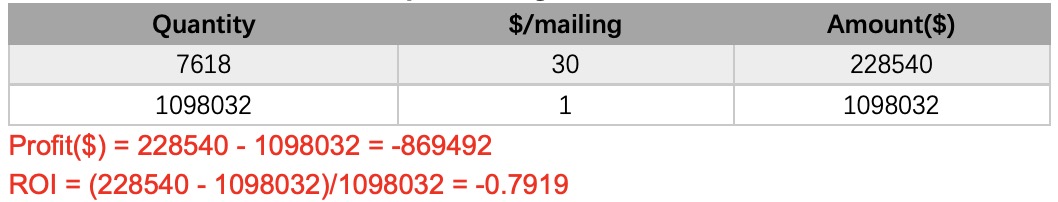
- Profits and ROI if we mail all the customers once
We have 85170 customers in total , and the response rate is 0.69%, so we can expect about 591 responses.
We can see that if we mail to every customer, we will face negative profits and ROI. So we need to find a baseline response rate. If we only mail to RFM segments with response rates higher than this baseline response rate, we can maximize our profits.
- How many to mail
Here, the profits and ROI are all negative. We can see that if we mail to no one, we can minimize our lost. The response rate here may be so under-estimated. Since we only consider those orders which are made within one week, a relatively short period, we may omit more responses than we expect.
In conclusion, by looking at the results above, we can find that if we only mail to RFM segments with response rates above around 4.21%, we can improve profits in the simple response rate case. The maximum profit is about $3625. Even though the profits and ROI are all negative in the effective response rate case, we can still find that segment 551, 552, 451, 553 both appear as top 4 segments in these two cases. So these are segments we should choose to mail.
Section C - Add Another Dimension to Target
C.1 Additional Dimensions
The hypothesis
Our new dimension is: Average spending on Location i.e., average dollar spent per order in each location. We sort customers by their average purchase amount by location, that is the sum of purchases (dollars) divided by the count of order for customers living within the same neighborhood (‘SCF_Code’). Setting the top 20% average spent on location as 5, and the least 20% as 1.
Our hypothesis is that by adding Average spending on Location to our RFM analysis, we can segregate our customers more accurately to reflect their potential buying behavior. Thus, with a more accurate customer segmentation, we can then make better contact and mailing decisions (intelligent targeting) and achieve higher profit.
Our RFM model with the added dimension will be referred to as the RFML model moving forward. The next sections contain our business and data justification for the selection of this new dimension.
Justification of new dimension - Business perspective The reasons for our new dimension selection are as follows:
Firstly, average spending on location allows us to estimate the spending power of our existing customer’s neighborhood. Based on our research, repeat customers will bring in more value because they will likely bring in referrals as new customers for the company. Hence, to capture the potential dollar impact of the referrals from our existing customers, we included average spending on location as the new dimension.
Next, by adding a location attribute (i.e. Average Spending on Location), we can better channel our intelligent targeting effort to specific locations and achieve more synergies and cost effectiveness e.g. bulk bargain for catalogue printing & distribution etc.
Additionally, by segregating our customers by average spending on Location, locations with similar spending power are similarly grouped. This in turn allows us to customize our marketing effort e.g. customized product catalogue for each tier. As research show that word of mouth is consistently 1 of the top 3 factors which influence a customer’s decision journey, if we can ensure that customers in similar location tier can be targeted and managed similarly, we will in turn improve their sense of satisfaction and word of mouth.
Justification of new dimension - Data perspective
In the following section, we perform a quick analysis to ensure the understanding of the relationship between RFM & L.
Next, we also check that our R,F,M,L params are indeed independent before we use them in our RFML model.
- Check on distribution and relationship
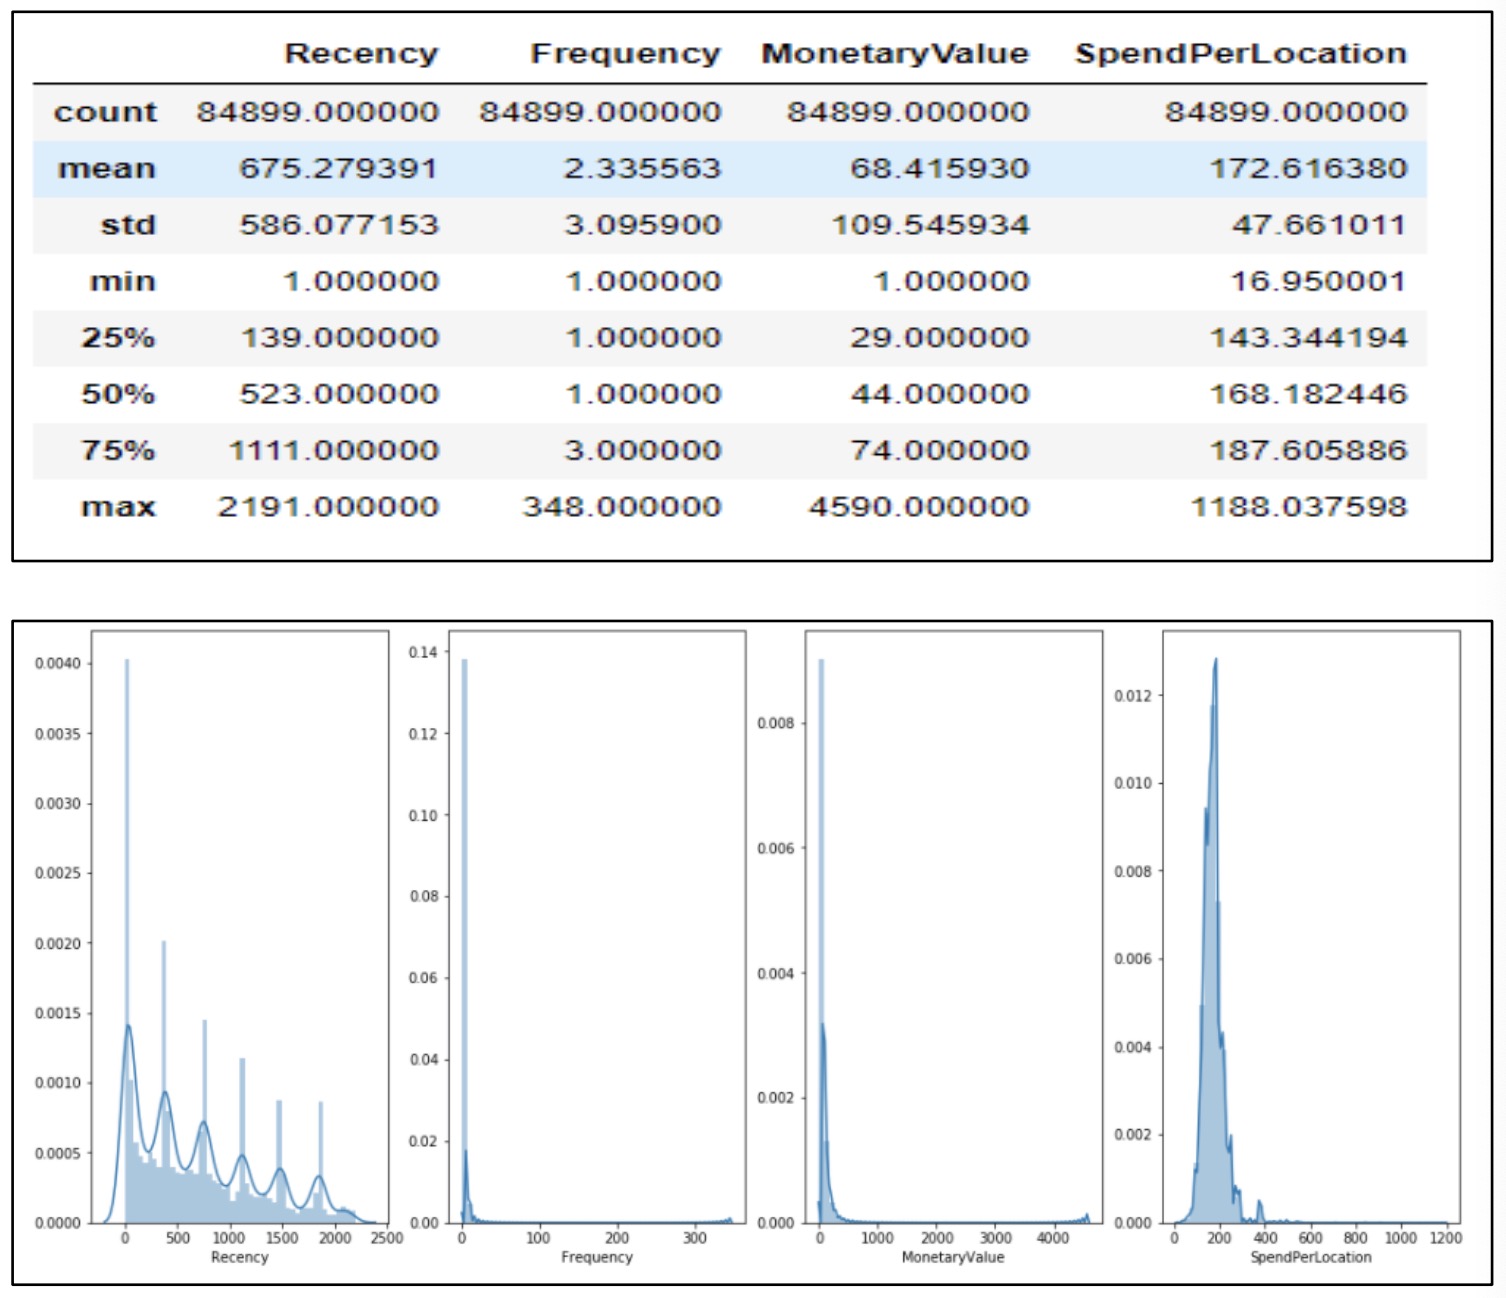
In the distribution plots above, Recency tends to spike at specific values across the plot. This is as expected as we have seen in our previous EDA that orders for the company tend to spike during Christmas due to the nature of the company’s product.
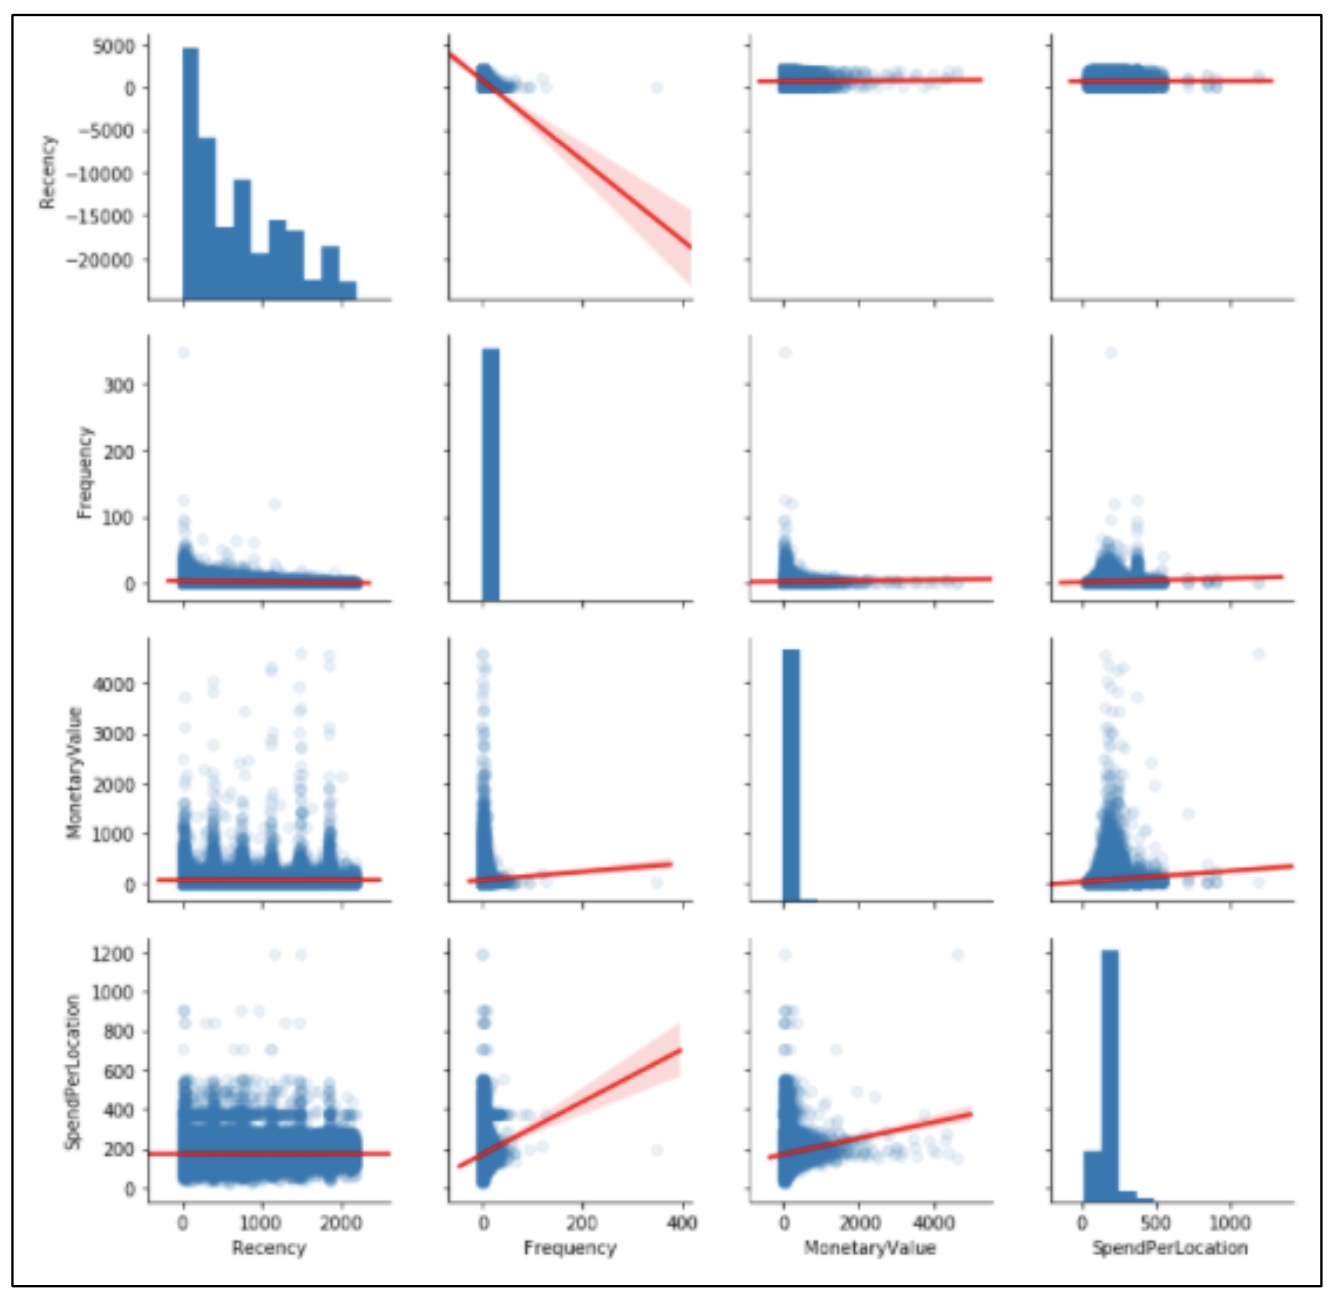
In the scatter plot matrix above, it seems that customers who purchase frequently tend to belong to high spending locations. Also, customers with high MonetaryValue (i.e. those who spend more in each order) tend to belong to high spending location too. This is not surprising since customers from high spending locations are likely to have high spending power to purchase more expensively and frequently.
- Check on independence
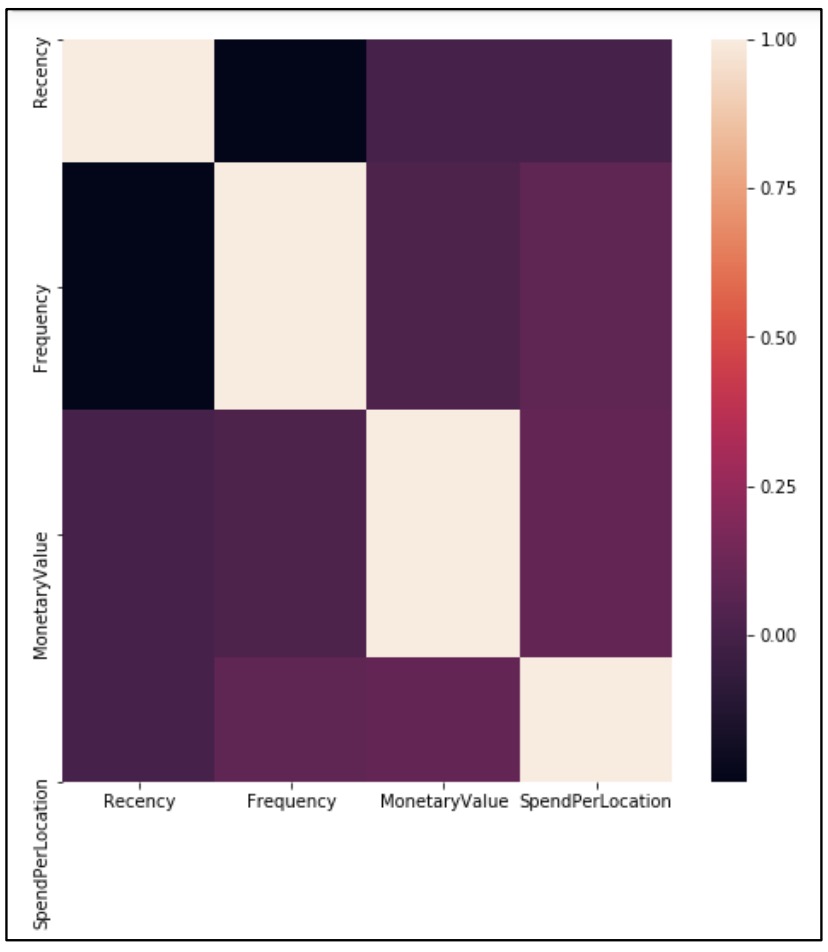
From the correlation heat map, it seems that the R,F,M,L params do not have a high correlation with each other. Also, none of the attributes display perfect collinearity with each other.
In summary, based on the above data analysis result, average spending per location displays a positive relationship with Frequency & MonetaryValue as expected. Also, average spending per location do not show any signs of perfect collinearity with R,F,M. With these positive results, we will proceed to add it into our RFM analysis to test our hypothesis.
C.2 RFML Segmentation
Justification of new dimension – RFML analysis
Like the approach used above, the snapshot date of our analysis is 2007-01-01. Hence:
- Customer’s buying behavior before 2007-01-01 will be used to calculate the R, F, M & L parameters.
- Customer’s contact and order data on and after 2007-01-01 will be used to calculate the response rate and validate the profit & ROI of our intelligent targeting approach.
To recap, our RFML params are calculated from data before 2007-01-01 with definitions as follows:
- Recency: Days till last purchase
- Frequency: Average number of orders per customer per year
- Monetary: Average dollar spent per customer per order
- Average spending on Location: Average dollar spent on each order in each location
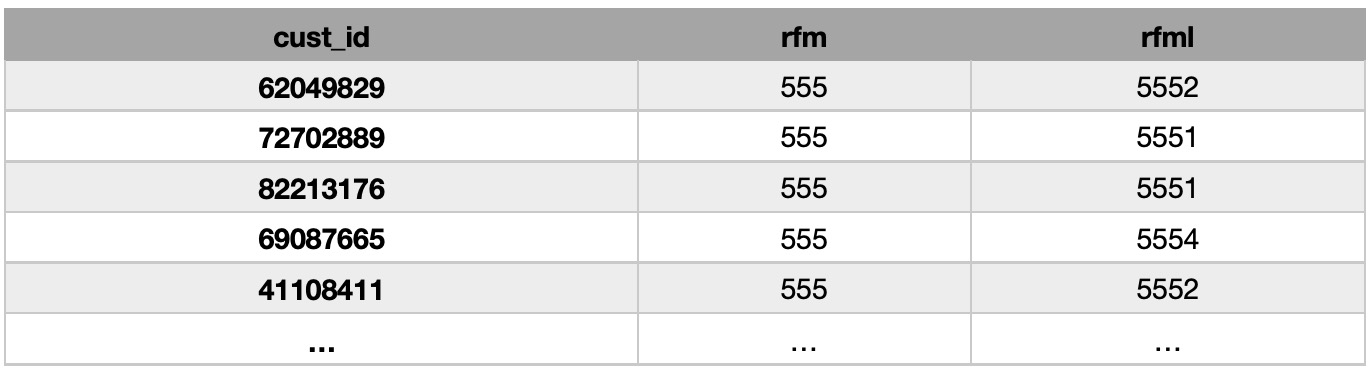
A brief version of the segmentation table is showed below:
C.3 Sample Mailing
We have used the same methods as in section B to reproduce to response rate, profits and ROI with our new segmentations.
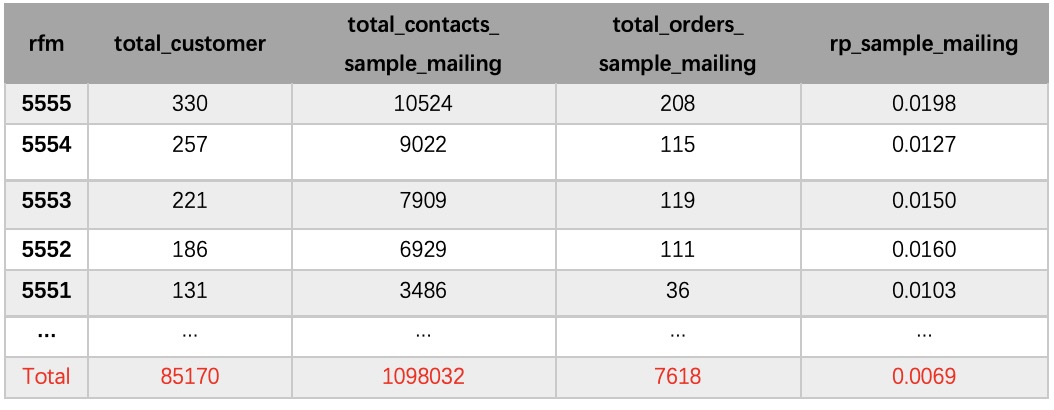
(i) Simple Response Rate
An overview of this sample mailing is showed below:
- Profits and ROI of the sample mailing
- Profits and ROI if we mail all the customers once
We have 85170 customers in total , and the response rate is 1.89%, so we can expect about 1607 responses.
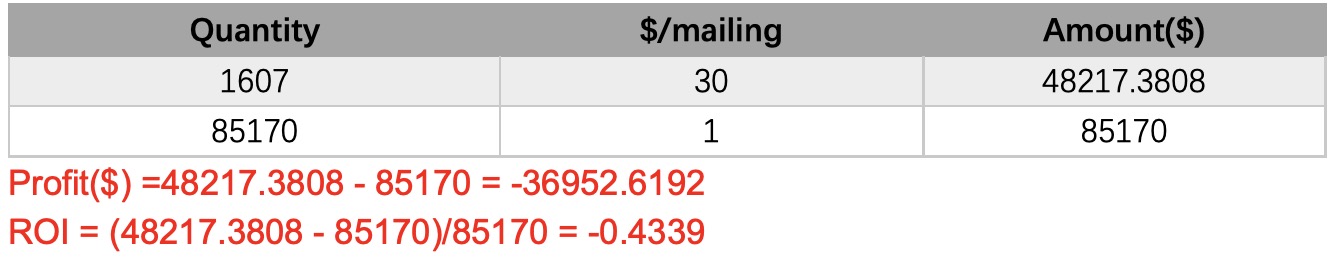
- How many to mail
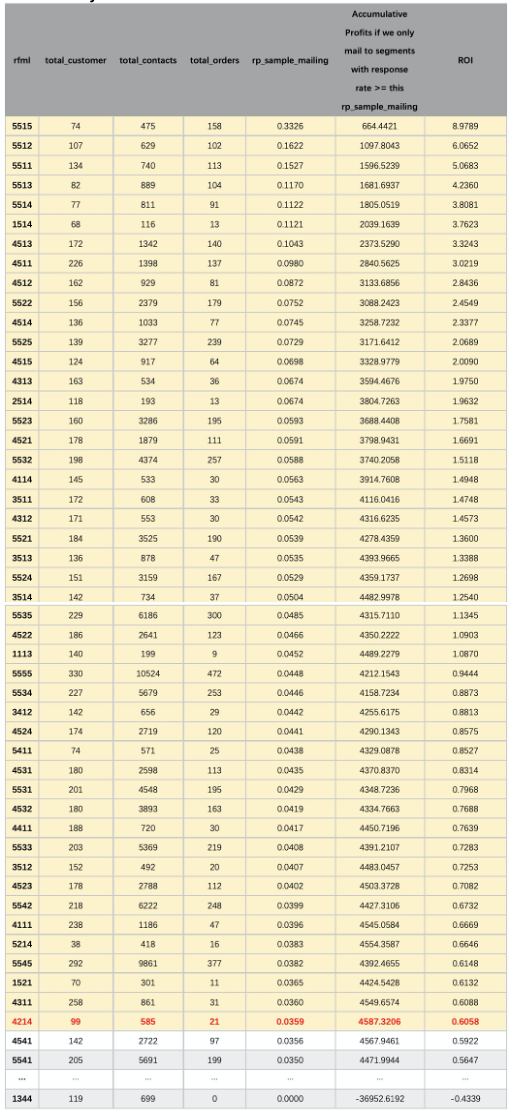
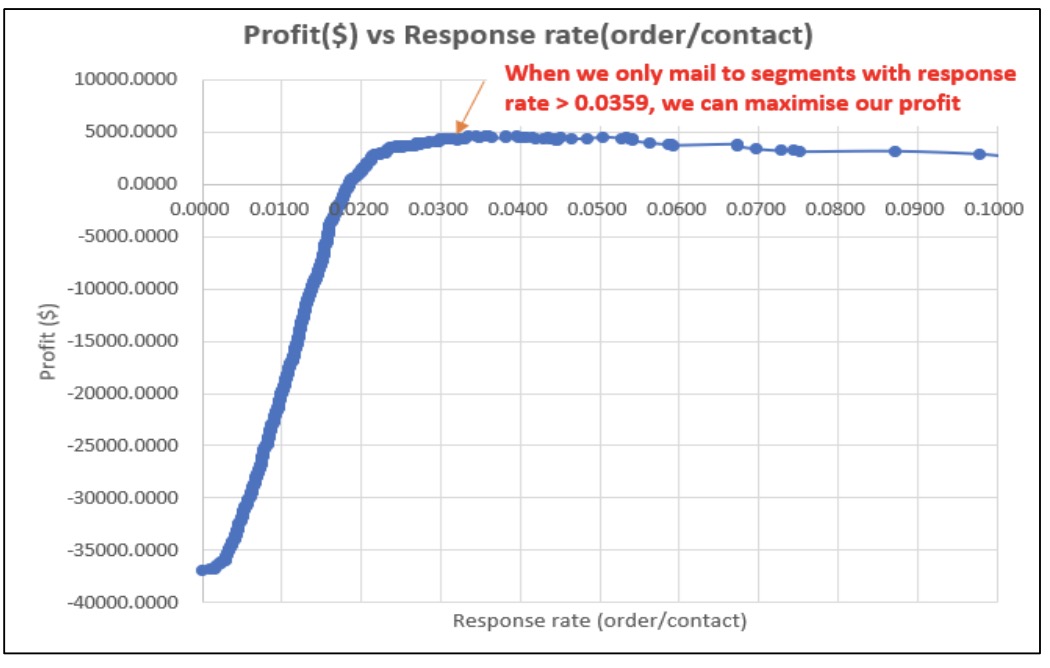
We can see that if we only mail to those segments with response rates higher than 3.59%, we can maximize our profit. It is 47 segments(7572 customers) in total and expected response rate is sum(158,102,…,21)/sum(475,629,…,585) = 0.0535. So if we mail to everyone in these segments, we expect roughly 5.35% × 7572 =405 responses. The profit will be about 40530 - 75721 = 4587. The ROI is about (40530 - 75721)/7572*1= 0.6.
Comparing with RFM simple response rate case which has maximum profit of $3625, we can see that we can improve the profits by adding dimension average spending on location.
(ii) Effective Response Rate
An overview of this sample mailing is showed below:
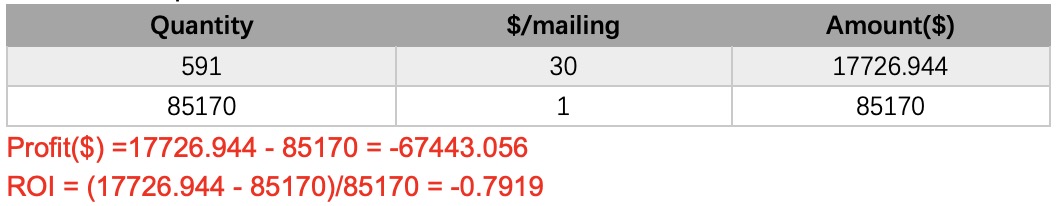
- Profits and ROI of the sample mailing
- Profits and ROI if we mail all the customers once
We have 85170 customers in total, and the response rate is 0.69%, so we can expect about 591 responses.
- How many to mail
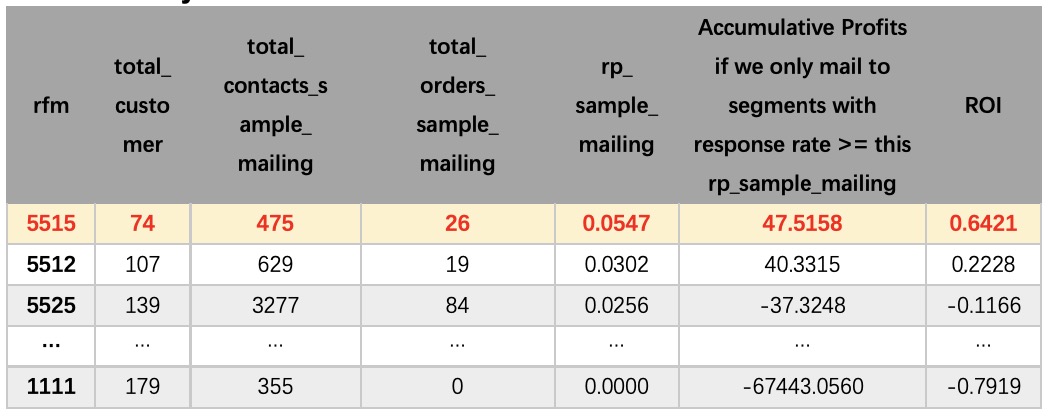
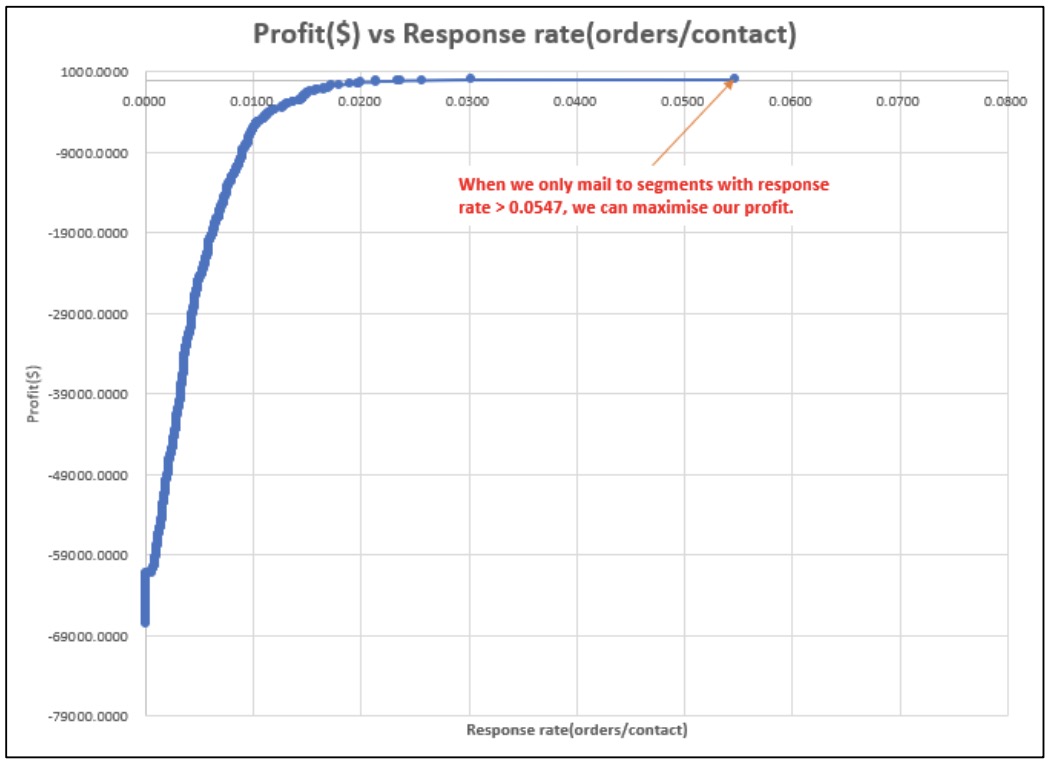
We can see that if we only mail to those segments with response rates higher than 5.47%, we can maximize our profit. It is 1 segments(74 customers) in total and expected response rate is 26/475= 0.0547. So if we mail to everyone in these segments, we expect roughly 5.47%74 =4 responses. The profit will be about 430 - 741 = 47. The ROI is about (430 - 741)/ 741= 0.6.
Comparing with RFM effective response rate case which has all negative profits, we can see that we can improve the profits by adding dimension average spending on location.
In conclusion, by looking at the results above, we can find that by adding the dimension ‘average spending on location, we can improve our profits in both case. Therefore, it is reasonable for us to include this dimension in our segmentation.
Section D - Conclusion and Recommendation
By conducting experimentation followed by intelligent targeting and only mailing customers segments above a threshold response rate, we would have achieved the following profit and ROI:
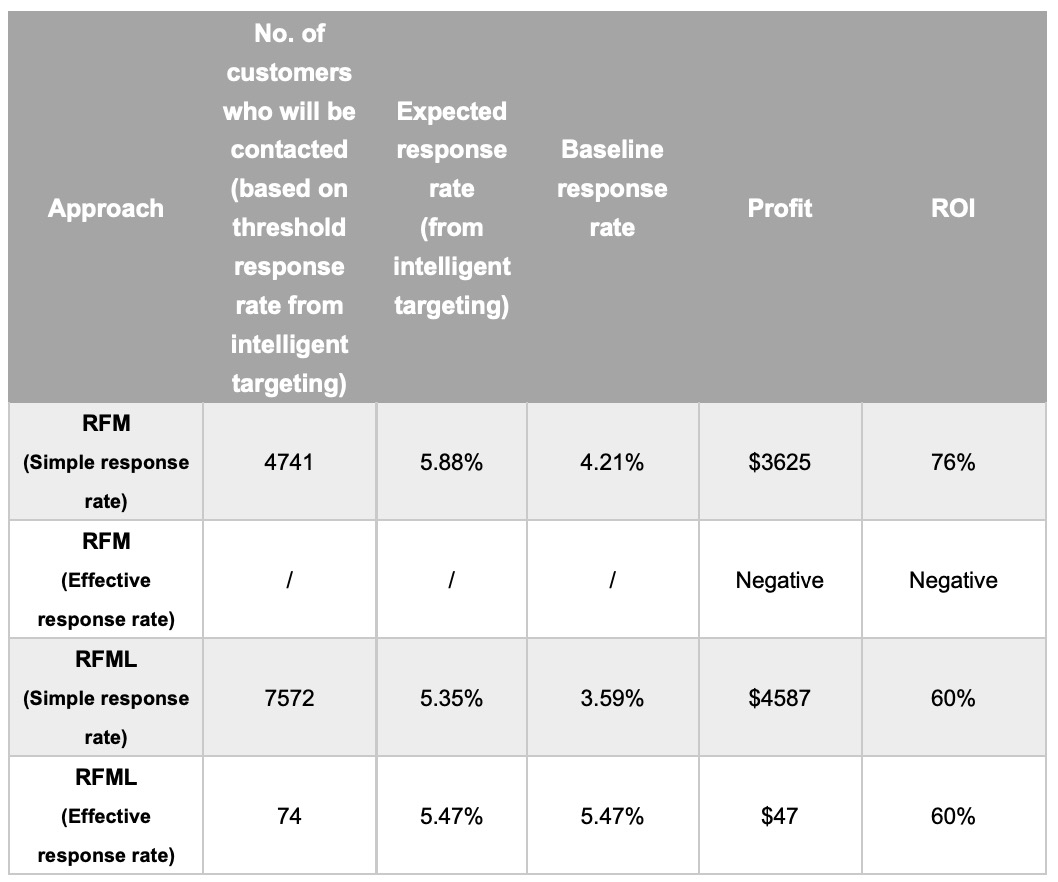
From the results above, we see that intelligent targeting with the RFML model will produce a profit which is approximately 26% higher than the RFM model. (i.e. $4587 vs $3625). Hence, applying intelligent targeting to this more granular and better segmented customer segments resulted in better profits as we have previously hypothesized.
Nevertheless, the ROI for RFML is lower at 60% compared to a 76% ROI for RFM. Thus, it seems that although our improved model allows us to zoom in on customers segments which have potentially higher response rate, the high cost of mailing (i.e. sending catalogues to the customers) will eventually erode our ROI.
As a next step, we recommend that the management seek further steps to reduce their mailing cost. E.g. switch customers contact mode to lower cost modes like emails, social networks. In this way, the RFML model can be better applied to achieve a higher ROI.
As a side note, we note that with the RFML model, our customer segments are more granular. i.e. we will have 625 customer segments compared to 125 customer segments. Higher number of customer segments can be ineffective in cases where there is limited data. Hence, if there are limited number of customers in each segment, we might not have sufficient clients to perform experimentation. Nevertheless, this was not the case for us due to the large customer database of the customer.
Section E - Limitations and Ideas for Improvements
Due to data constraints, our analysis has its limitations. The following are future ideas for improvements:
- 1. Better accuracy on cost of mailing (email vs catalog)
Our analysis assumes the same cost for that both email vs catalog contact. In reality, we know that emailing is generally cheaper compared to sending of physical catalogs. Hence, moving forward, we can improve our analysis by gathering further contact cost data to arrive at a better profit and ROI calculation.
- 2. Quantify impact due to promotion or other marketing campaigns
In our analysis, we assumed that the response rate we observe in 2007 are solely due to the mailing contact which had been made with the client. Practically, we know other factors such as promotions will have an impact on the response rate too. Moving forward, we should try to gather other marketing campaign data for further analysis on their impact to the response rate.
- 3. Measure impact due to each contact type (email vs catalog)
In the data, the same customer might receive both catalog and email at any 1 time. Hence, it is tough to attribute the impact on the response rate due to a single contact type (email vs catalog). Moving forward, we would suggest doing A/B testing to single out and measure the impact of each contact type on a customer.
References
-
Mckinsey.com (2010) A new way to measure word of mouth marketing. Available from: https://www.mckinsey.com/business-functions/marketing-and-sales/our-insights/a- new-way-to-measure-word-of-mouth-marketing# [Accessed 21 Feb 2021]
-
Media.bain.com (2020) The value of online customer loyalty and how you can capture it. Available from: https://media.bain.com/Images/Value_online_customer_loyalty_you_capture.pdf [Accessed 21 Feb 2021]
-
Deloitte.com (2020) New Year & Christmas 2020 Spending Survey. Available from: https://www2.deloitte.com/ru/en/pages/consumer-business/articles/2019/new-year- spending-survey-2020.html [Accessed 21 Feb 2021]