In this project, we had a very exciting firsthand experience of ‘running’ a business. We first design and launch our own website by Weebly, and use tag manager to monitor the site via Google Analytics. To find out a more effective plan for our website design, we conduct an A/B test through analysing the real data we collect over a few weeks.
The full report contains:
Section A - Business Context
- Introduction
- Business Interest
Section B – Test Design and Implementation
- Test Design
- Test setup in Google Tag Manager and Google Analytics
- Test implementation
Section C – Analysis
- Exploratory Data Analytics
- A/B test on ‘JOIN US!’ Button with CTR Evaluation
Section D – Further insights & Improvements
- Improvement 1: Separate testing for mobile vs desktop users
- Improvement 2: A/B testing using Google optimize
Section E: Conclusion and Reflection
Section A - Business Context
A.1 Introduction
We are a new start-up travel consultancy company, set up by four travelling enthusiasts who like traveling around the globe exploring new places and experience. We are interested to share our great experience with others, hence offering this service to provide customized tour consulting service to customer in curating the personalized tour itinerary, accommodations, logistic planning based on our experience and network across different continents. With the personalized plan offered, customer could save time in doing the tour planning work, grab their luggage, and enjoy the travelling.
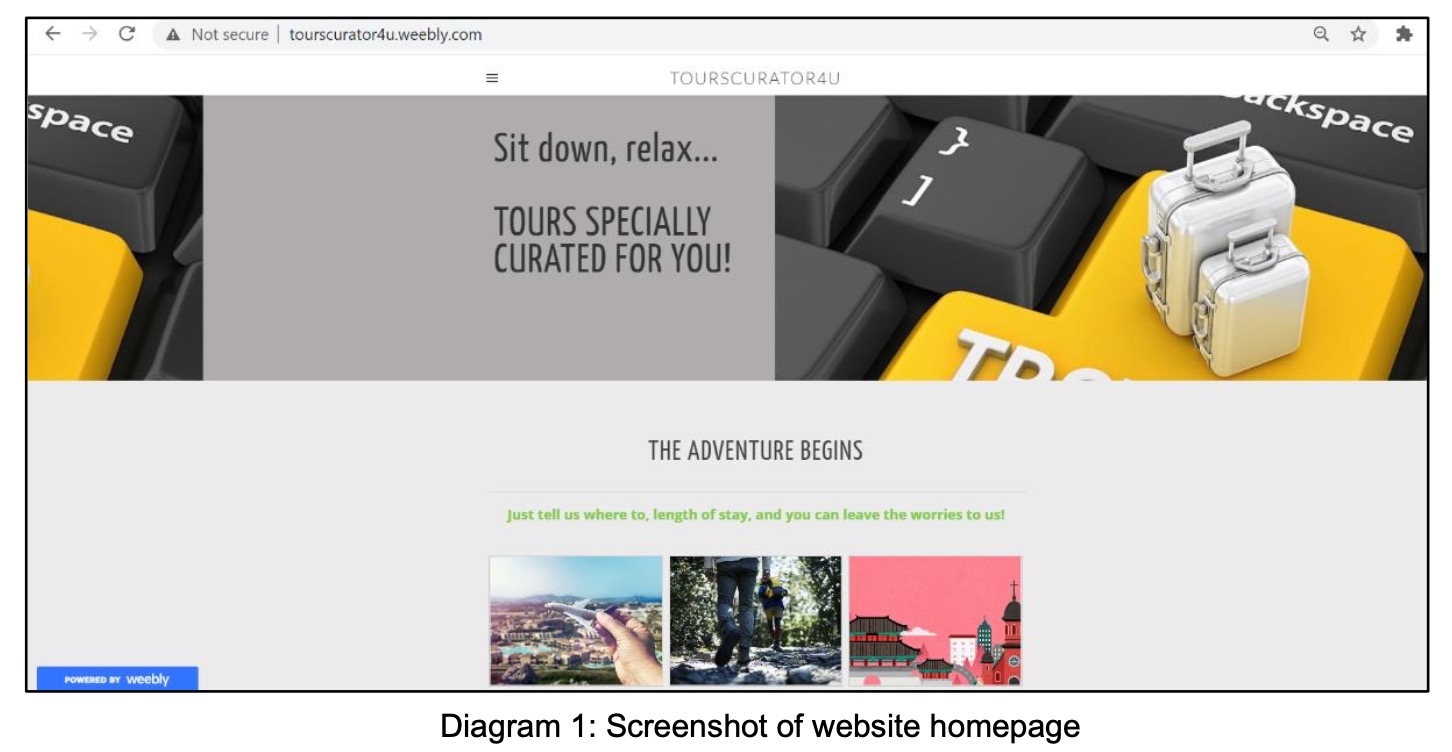
We have developed a website (http://tourscurator4u.weebly.com/) to showcase our service and as one of the means to spread our business. Our website is structured with a home page, and three sub-pages, which reflects our main three offerings:
- City/Urban tour
- Cultural tour
- Adventurous tour
In order to build and expand our customer base, we plan to use our website to attract potential customers. We have created a ‘JOIN US!’ button in our website, which enables our website visitors to become our member. We would like to use this ‘JOIN US!’ button to collect more customer information, such as contact information, demographic information, interests, etc, to better segmentize our customer, provide customized service, as well as providing targeted engagement like travelling tips, blogs. In addition, for every click of ‘JOIN US!’ button, it offers opportunity for us to respond and offer follow-up of customized and personalized tour advices, hence turning in potential revenue.
For click of button in every session by visitor, we will be able to follow-up with the visitor. Say, a visitor views our website, interested to get our service, and clicks the ‘JOIN US!’ button on day 1. We will respond accordingly. If the same visitor comes back a week later and have another idea in mind to explore another tour, he/she can click ‘JOIN US!’ button again, for a new service offering for the new tour. Similarly, we will respond to the new request received.
A.2 Business Interest
It is important for us to capture the visitors who click the ‘JOIN US!’ button as that represents potential revenue with every click. Click through rate (CTR), which is clicks over impressions, would be a key indicator in our website design for a new start-up as we will rely on the website in offering services in different countries. Having no website before, CTR would be a more important indicator in evaluating the current website design in turning in clicks by visitor, or attractiveness of webpage design to convert a click from visitors; rather than conversion rate despite the true revenue will be measured from conversion rate. Converting a visitor into true revenue will be subjected to offering of service by the company in responding to the visitor’s click. Therefore, it is our immediate interest in our website design to attract visitors to join us.
Unsure of how effective would be our website design in capturing the visitors attention to the ‘JOIN US!’ button, we intend to perform an A/B test to decide where to put our ‘JOIN US!’ button. We are considering two design options:
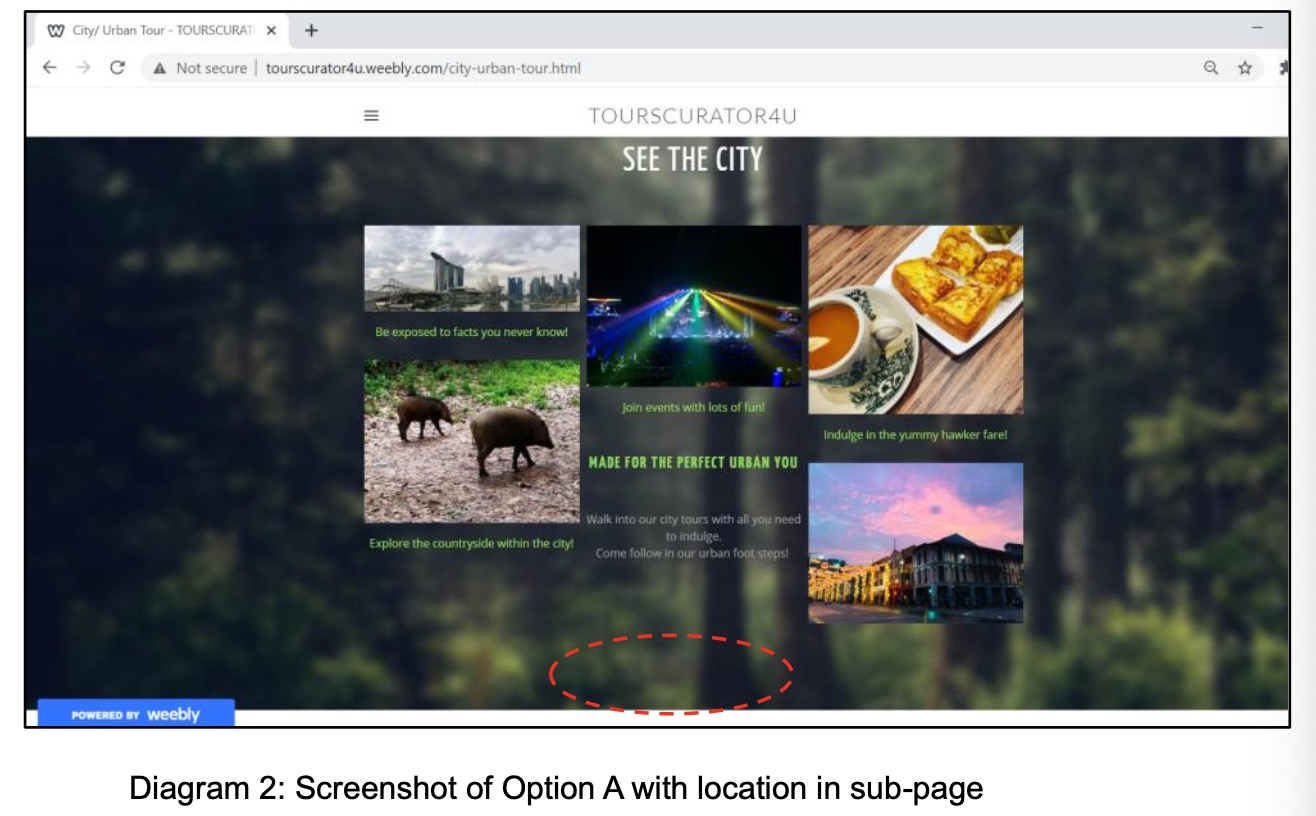
- Option A. Put ‘JOIN US!’ button on the subpages of our website, which are city/urban tour page, cultural tour page and adventurous tour page. In each subpage, we provide a specific kind of tour with some photos and introductions. We think people may be more willing to click to proceed leaving a contact with us to follow-up when they view the individual sub-page showing offerings by tour type, which is meeting their interest.
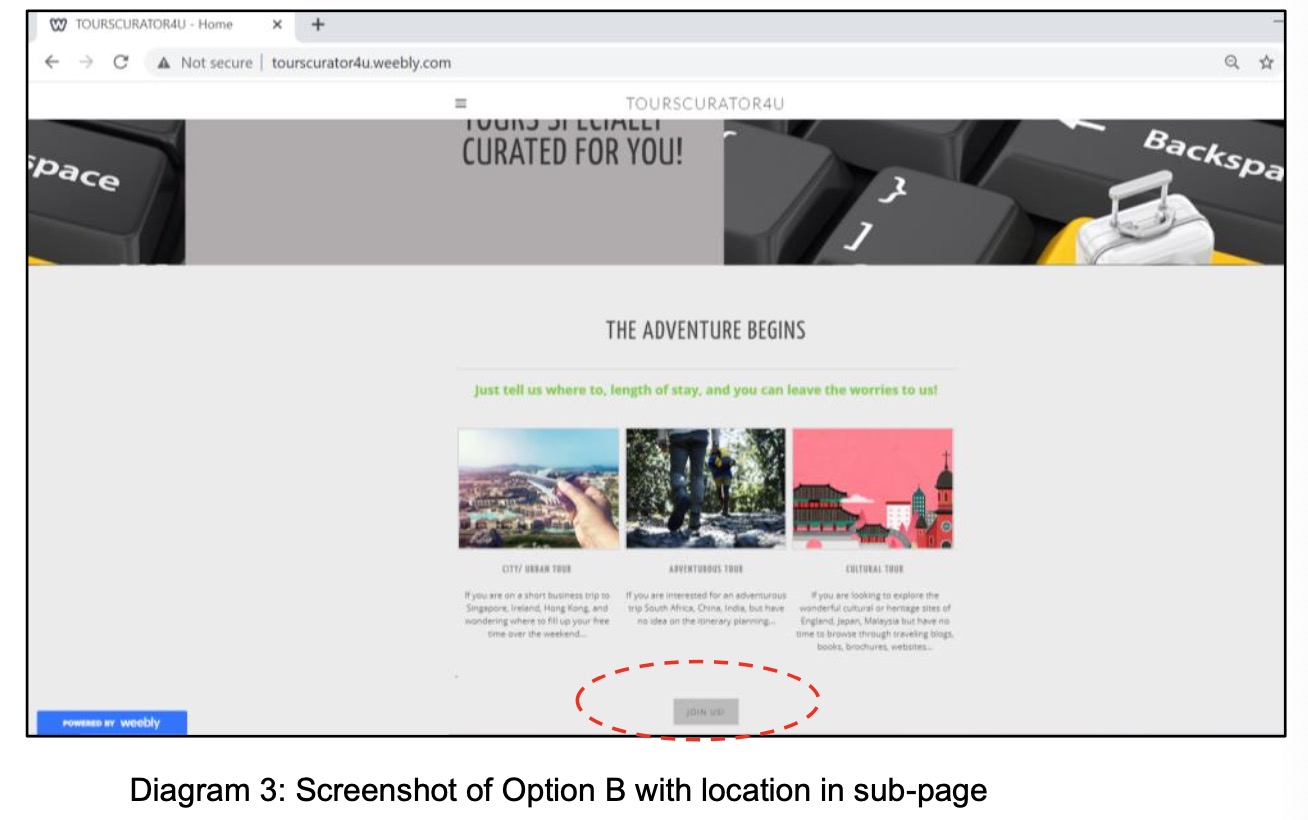
- Option B. Put ‘JOIN US!’ button on the homepage of our website. Normally, the homepage is the most viewed page and putting the ‘JOIN US!’ button there is the most direct way. When visitors come into our website, they can easily see the ‘JOIN US!’ button without taking several minutes to go through all the subpages. It is kind of a guarantee that every visitor can see the ‘JOIN US!’ button.
We will implement this A/B test on the above two design on placement of ‘JOIN US!’ button, and evaluate its CTR.
We are going to use built-in functions from Google Tag Manager and Google Analytics to tag our website, and subsequently extract the relevant data to evaluate each CTR. In addition, we will use data extracted from Google Analytics to explore analytics on visitors’ profile, i.e. device access and page view, so that we can improve our website design.
Section B - Test Design and Implementation
B.1 Test Design
B.1.1 Test Size
As the business interest is to use the A/B test to determine the best location of placing the ‘JOIN US!’ button for leading visitors to click and then leave their personal information on this newly launched website, we need to get sufficient number of visitors for the A/B test to be done. We use the following assumption in determining the required sample size (or minimum visitors) to run our test.
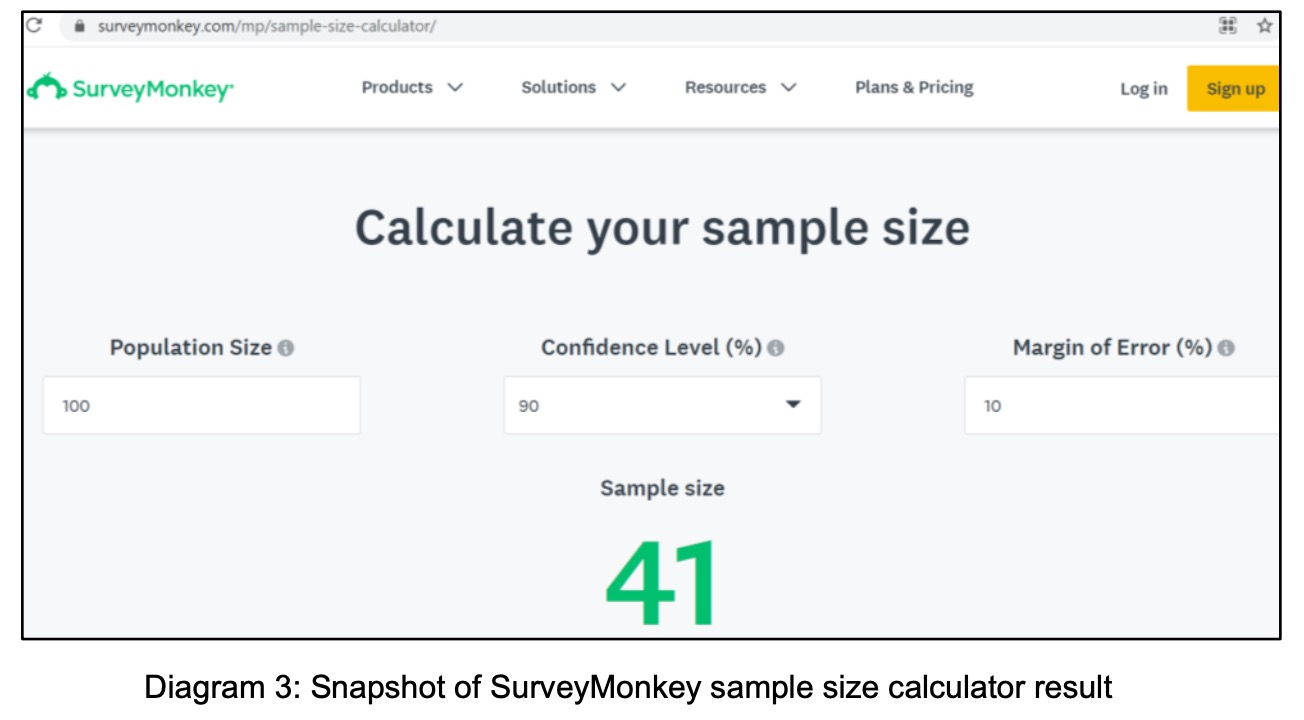
- As a new business entity, we set our 1st business target as acquiring the first 100 visitors to view our website as one of business milestone. Given the COVID-19 pandemic spread when we set up the business and the website, we expect headwind in promoting our business idea for people to look-up for tours consulting services. Therefore, we assume 100 as our population size, and we set a 10% margin of error, with a 90% confidence interval (lower than the industry norm of 95%). The high margin and lower confidence interval would make our sample size smaller, but faster to acquire the necessary test samples to test our website and offering in the beginning stage (and in the challenging time of COVID-19 pandemic).
- We use available sample size calculator from SurveyMonkey to calculate the required size.
- The result using the SurveyMonkey sample size calculator shows a sample size of 41.We will need to get at least 41 samples for our A/B test.
B.1.2 Test Hypothesis
In comparing OPTION A and OPTION B, the objective is to determine which ‘JOIN US!’ button will receive more clicks. Hence we will set the performance evaluation on “click-through-rate”, or “CTR”, where \(CTR = \frac{unique clicks}{unique impressions}\).
We do not know if OPTION A or OPTION B would lead to the same CTR. Therefore set our A/B test hypothesis as followed:
\(H_0:CTR_{OPTION_A}=CTR_{OPTION_B}\)
\(H_1:CTR_{OPTION_A} \neq CTR_{OPTION_B}\)
If the CTR is different, we will then select the design option that contribute to a higher CTR as our design choice.
B.2 Test Setup in Google Tag Manager and Google Analytics
We plan to use Google Tag Manager to track button clicks into Google Analytics.
(1) View the source code
In Chrome, we could right-click the button and select ‘Inspect’. This will open Developer Tools, allowing us to view the source code of the page.
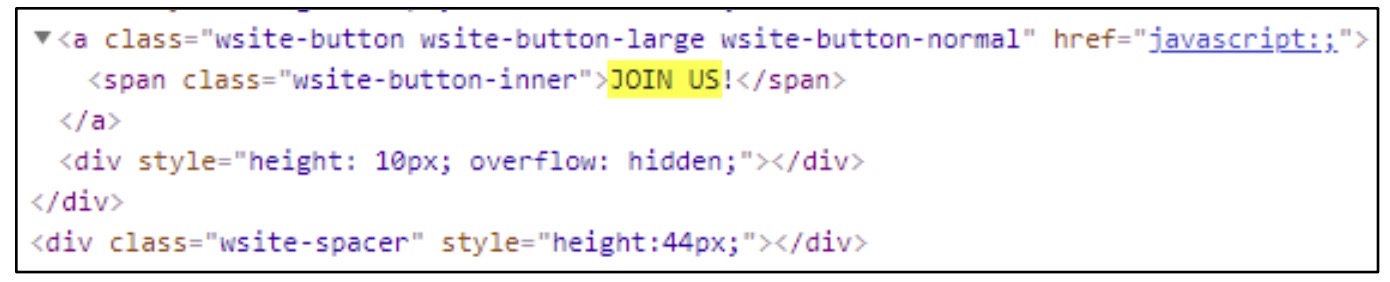
We could see that the button locates in a form and that the button has a class of “wsite-button wsite-button-large wsite-button-normal”. We could track button clicks by using the class in Google Tag Manager.
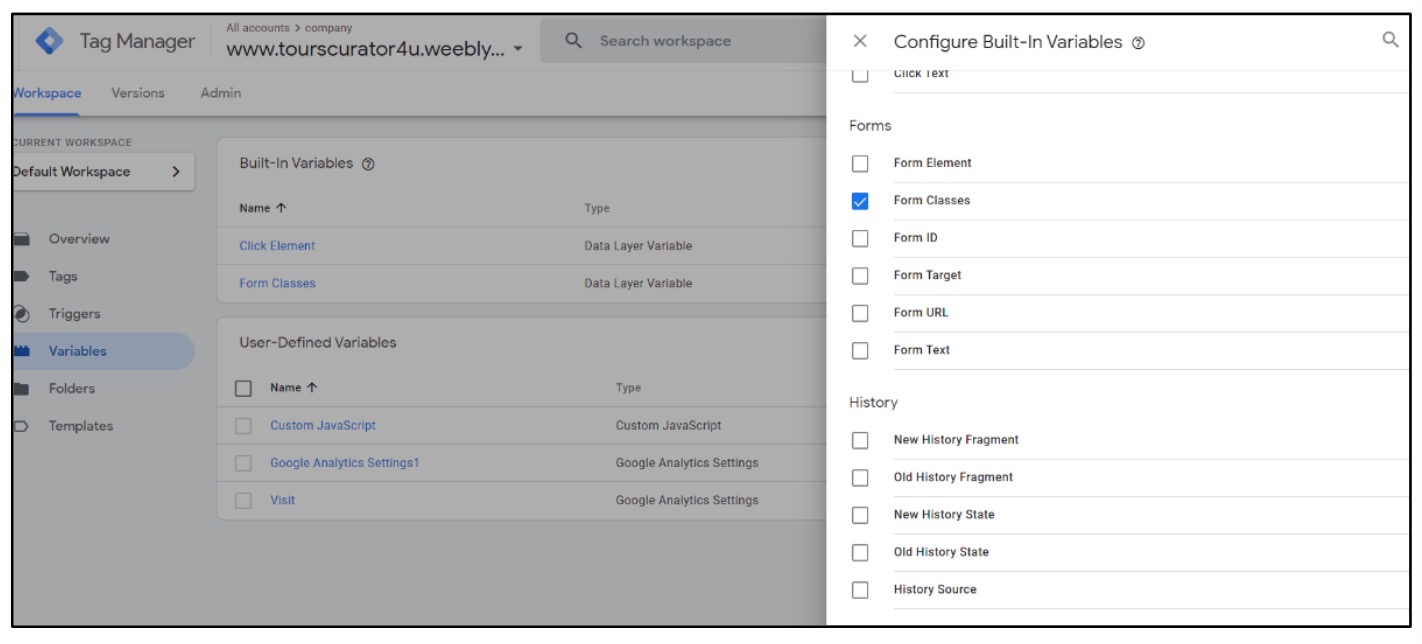
(2) Enable the variable
Google Tag Manager has a range of built-in variables that automatically make the details of interactions available when configuring tags and triggers. For example, we can use variables to check whether someone views a particular page, watches an embedded video, scrolls down a page, or in our case, clicks a particular button on our website.
Since we have identified the button’s class, we could enable ‘From Class’ from build-in variable.
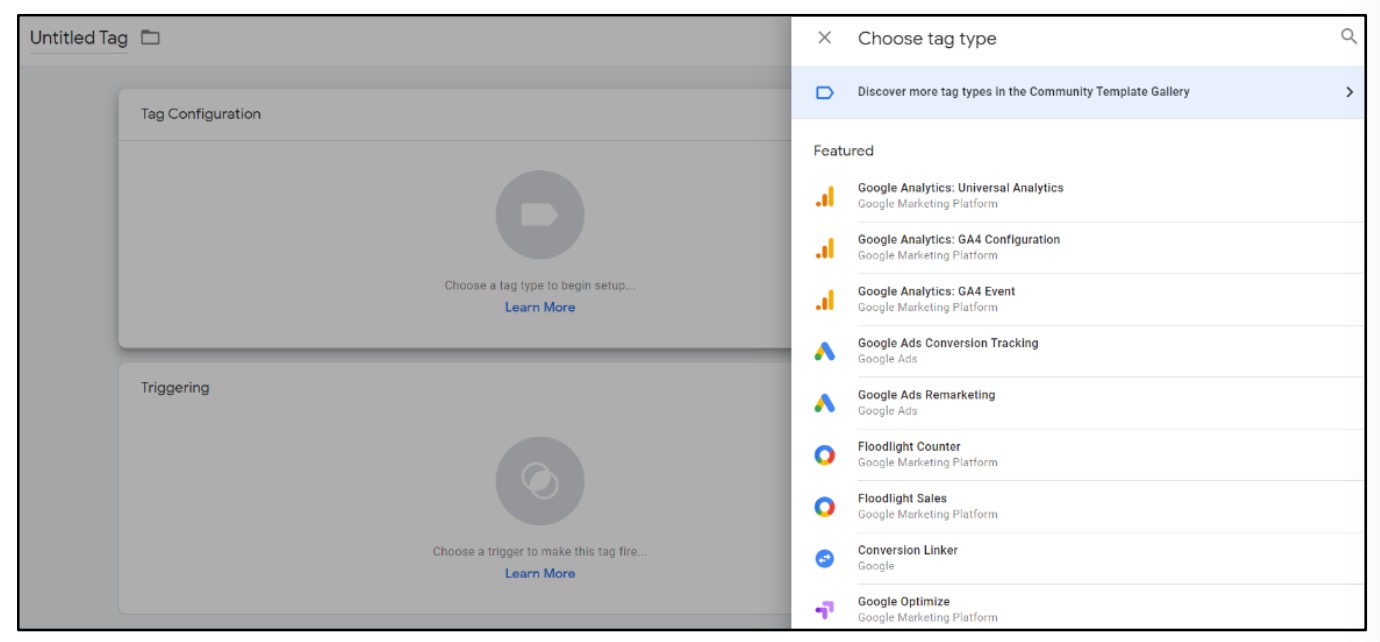
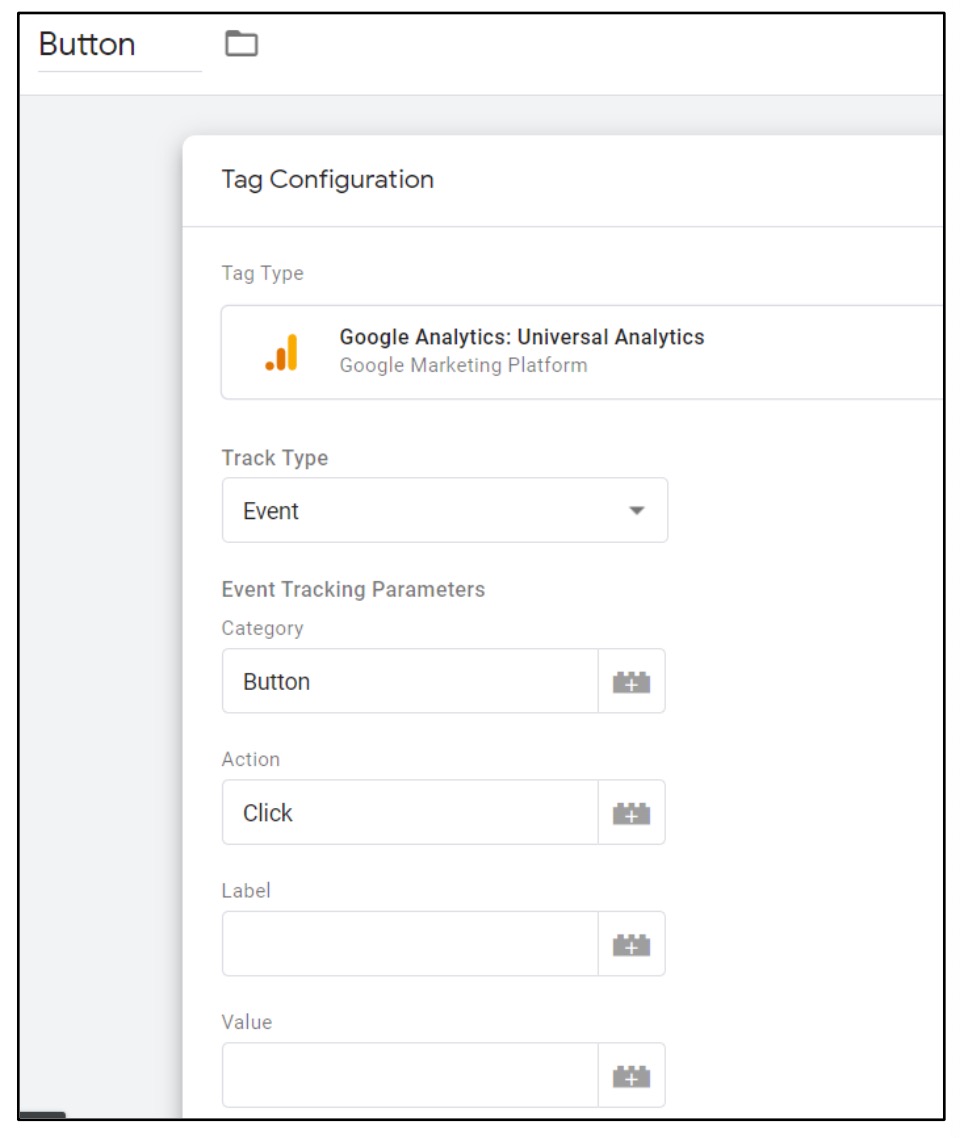
(3) Create a tag
Now, we could create our tag which will send data to Google Analytics when our button is clicked. Select ‘Tags’, click ‘New’ and name our tag ‘button’. After that, select ‘Google Analytics: Universal Analytics’ from Featured tab. Change the Track Type to ‘Event’, and enter the ‘Button’ as Category, ‘Click’ as the Action.
Before we save our new tag, we still need to add a trigger.
(4) Create a trigger
Trigger tells Google Tag Manager when a tag should (or shouldn’t) fire. For our button click tag we need to create a trigger so that the tag only fires when our button has been clicked. To do this, we select ‘Triggering’ for the tag to create a new trigger. In our case, we select ‘All Elements’ from Click section in trigger type.

Now we need to change the trigger so that it only fires on some clicks. We then select ‘Form Classes’, ‘Equals’ and enter the class we identified when we viewed the source code of our page.
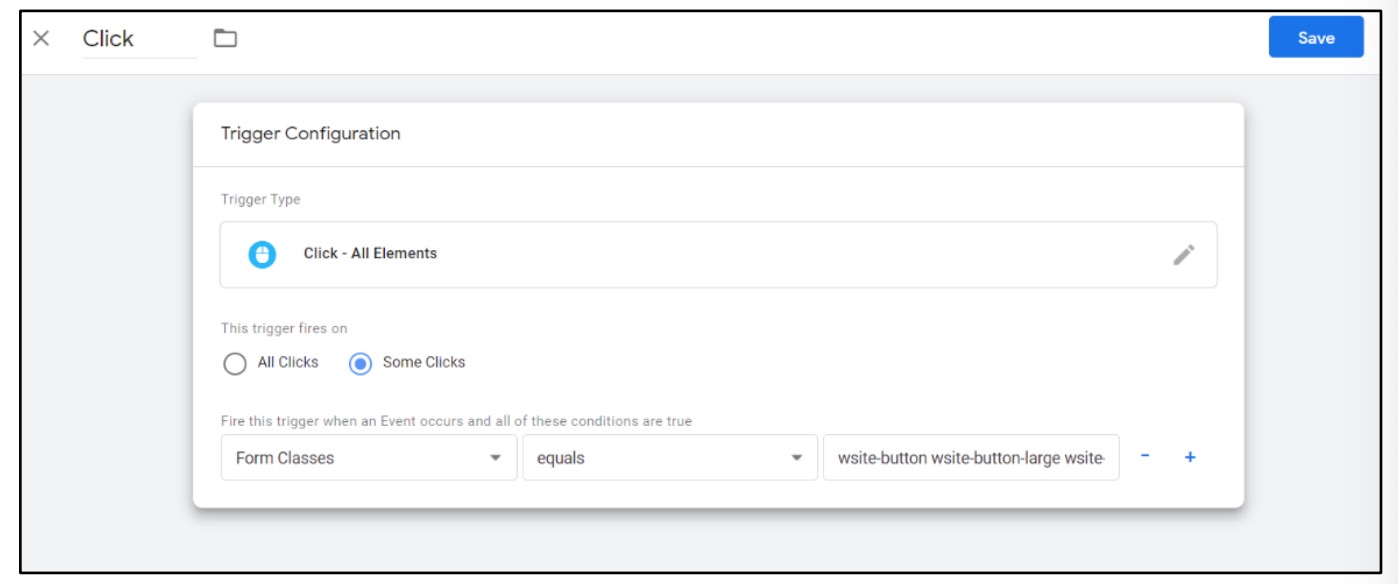
Now, we could save the trigger, then save the tag.
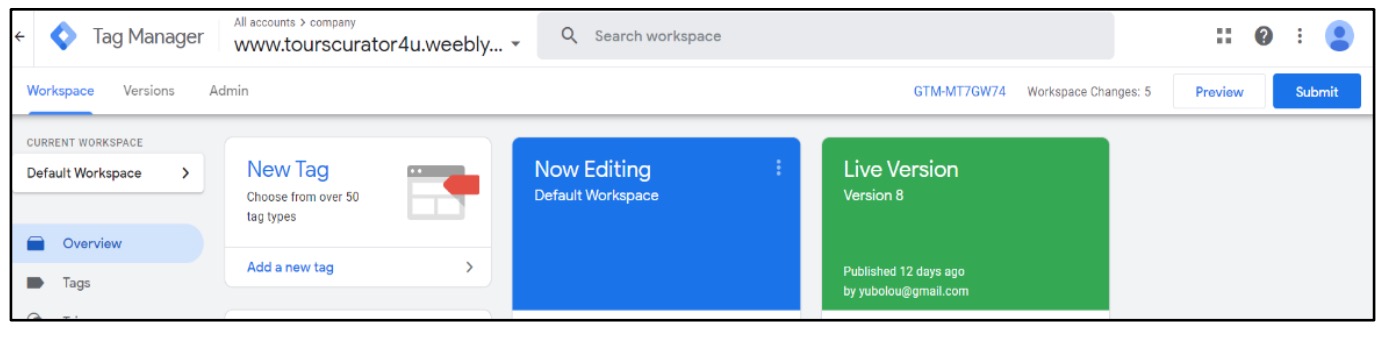
(5) Publish the container
Click ‘Submit’ from the Workspace page of Tag Manager to publish the container to our website.
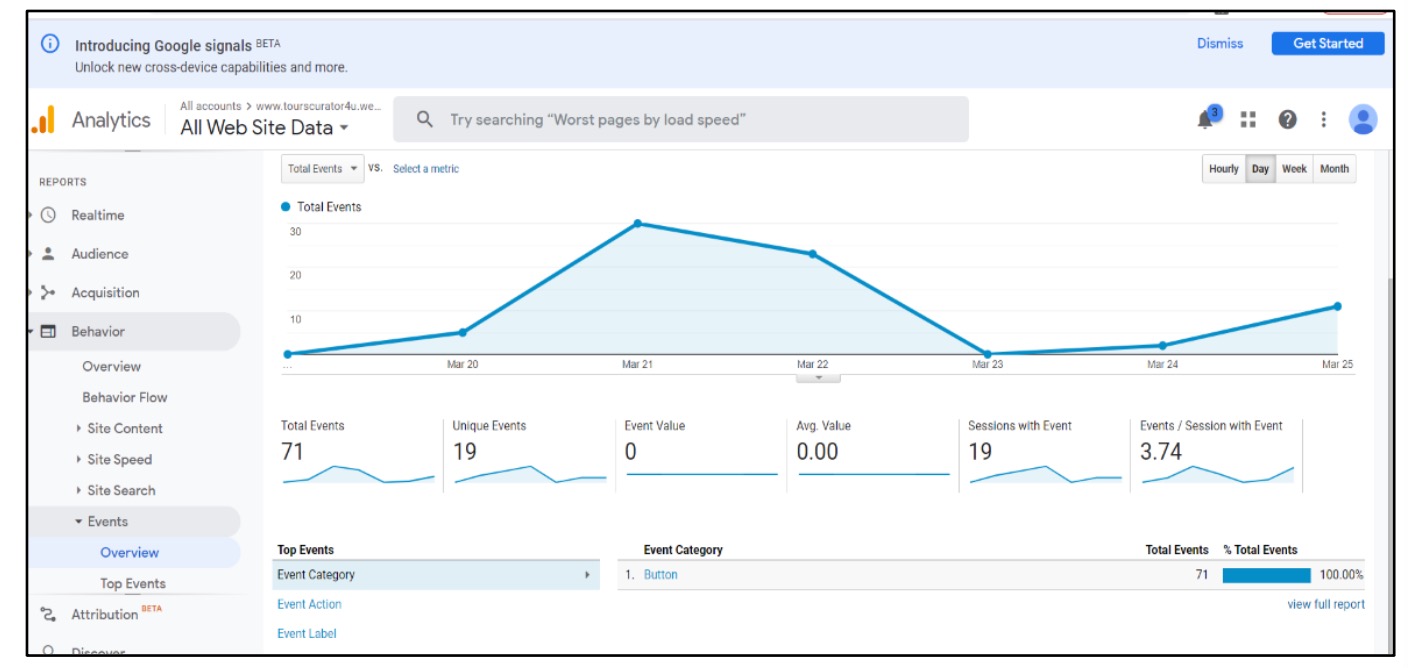
(6) Check Google Analytics
Now, we should be able to see the click data from ‘Behaviour’ in Google Analytics.
B.3 Test Implementation
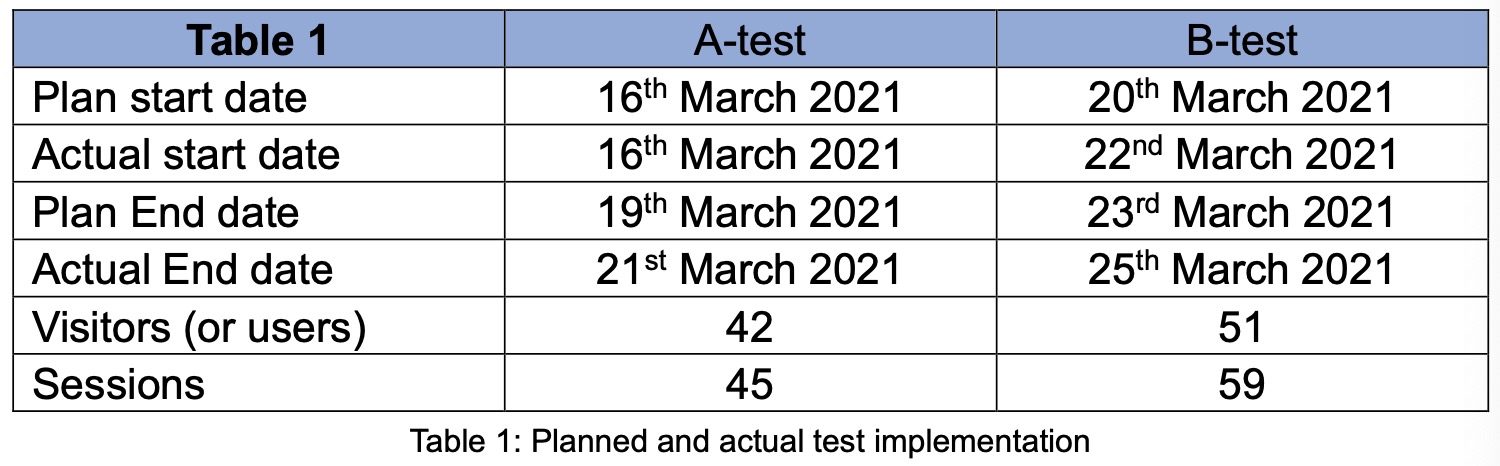
After we have finalized the test setting in Google Tag Manager and Google Analytics, we published our website on 14th March 2021. We set our 1st test on 16th March ~ 19th March 2021, representing the A-test, and 2nd test on 20th March ~ 23rd March 2021, representing the B-test. We used the gap between 14th March 2021 and 16th March to familiarize ourselves to operate Google Analytics, where preliminary data was collected and analytics performed to understand functionality of Google Analytics. These data were not used in our A/B test.
We reached out to own connections (friends, colleagues, university cohorts), spreading the website address to acquire the required sample size. We mainly spread the word about our website through social media platform, i.e. Whatsapp, Facebook. We tracked the daily users, and views in Google Analytics.
We had initially planned for 4 days per test, where we have the design OPTION A for the first 4 days, and changed the website to design OPTION B on the 5th day, which is 20th March 2021. With the target sample size of 41 samples, and estimation of getting approximately 10 visitors per day (or with each group member turning in 10 visitors among his/her network, leading to at least 40 sessions), we had planned for 4 days duration for each test, to meet the sample size of 41.
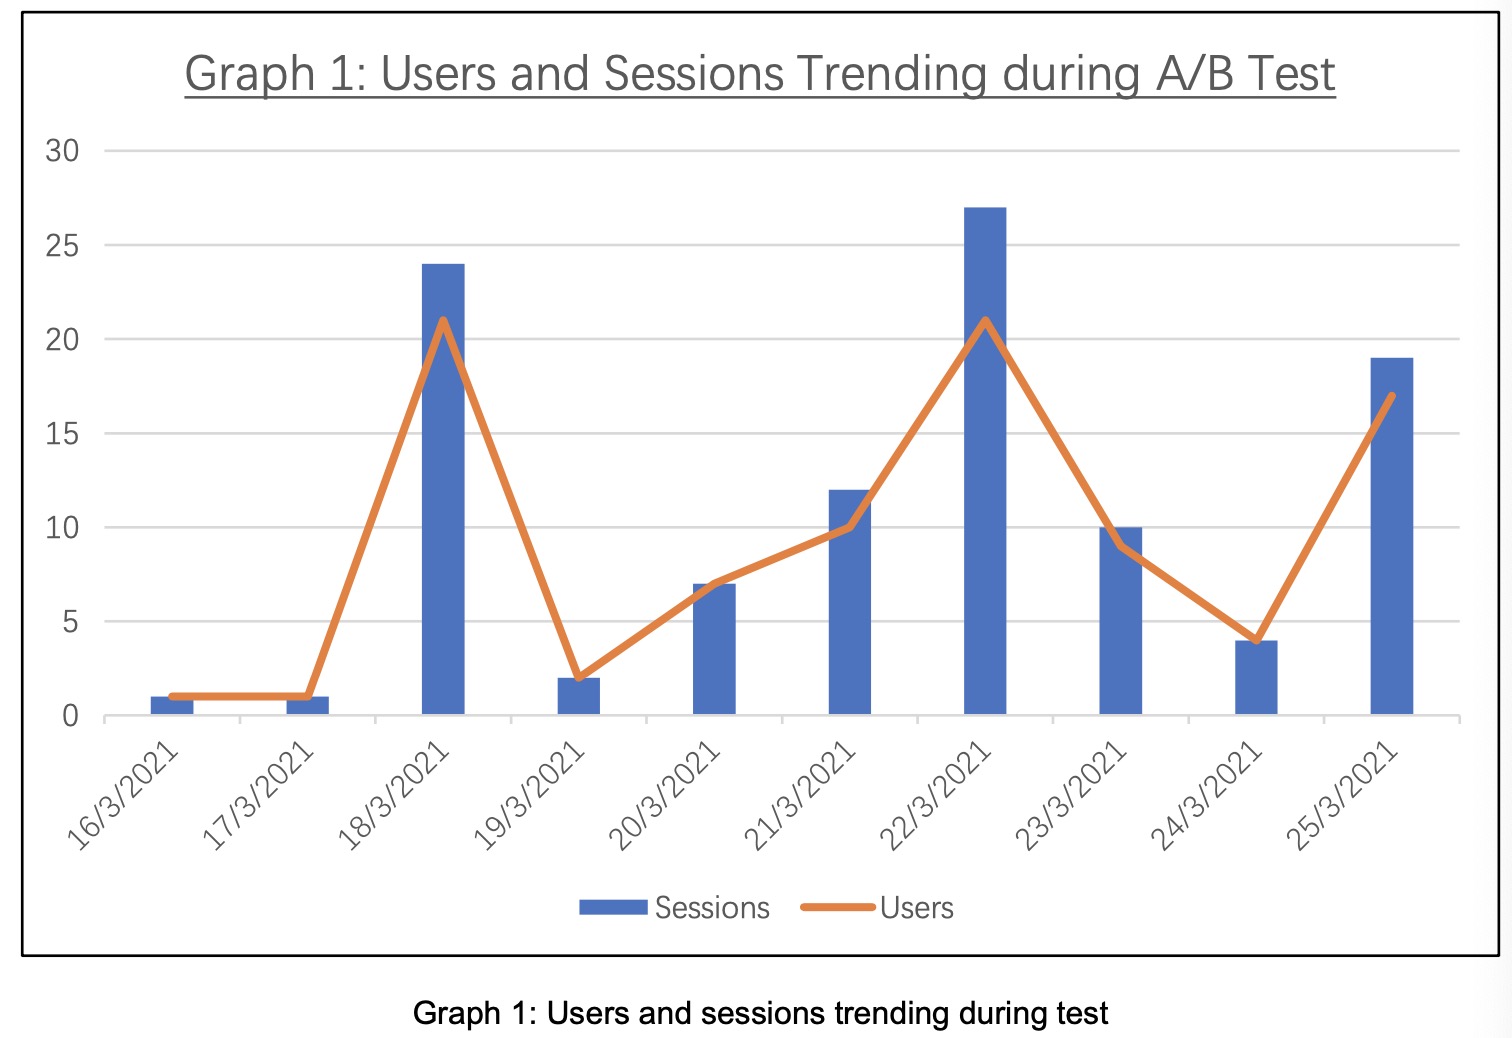
Unfortunately, we had managed to get 2 visitors on A-test in the first 2 days. It gained traction on day-3 (18th March 2021) after more promotion among circle of connections. At the initial planned finish date of day-4 (19th March 2021), we could only accumulate 25 users and registered 28 sessions, short of the required sample size target. Therefore, we had to extend our test duration, and managed to acquire 42 visitors and 45 sessions recorded as of 21st March 2021. We then switched the design to OPTION B to run B-test on 22nd March 2021.
The following Table 1 shows the plan and actual test implementation dates.
The following Graph 1 shows trending of users and sessions for A-test (16th ~ 21st March 2021) and B-test (22nd ~ 25th March 2021)
Section C - Analysis
C.1 Exploratory Data Analytics
C.1.1 Pageviews Analysis
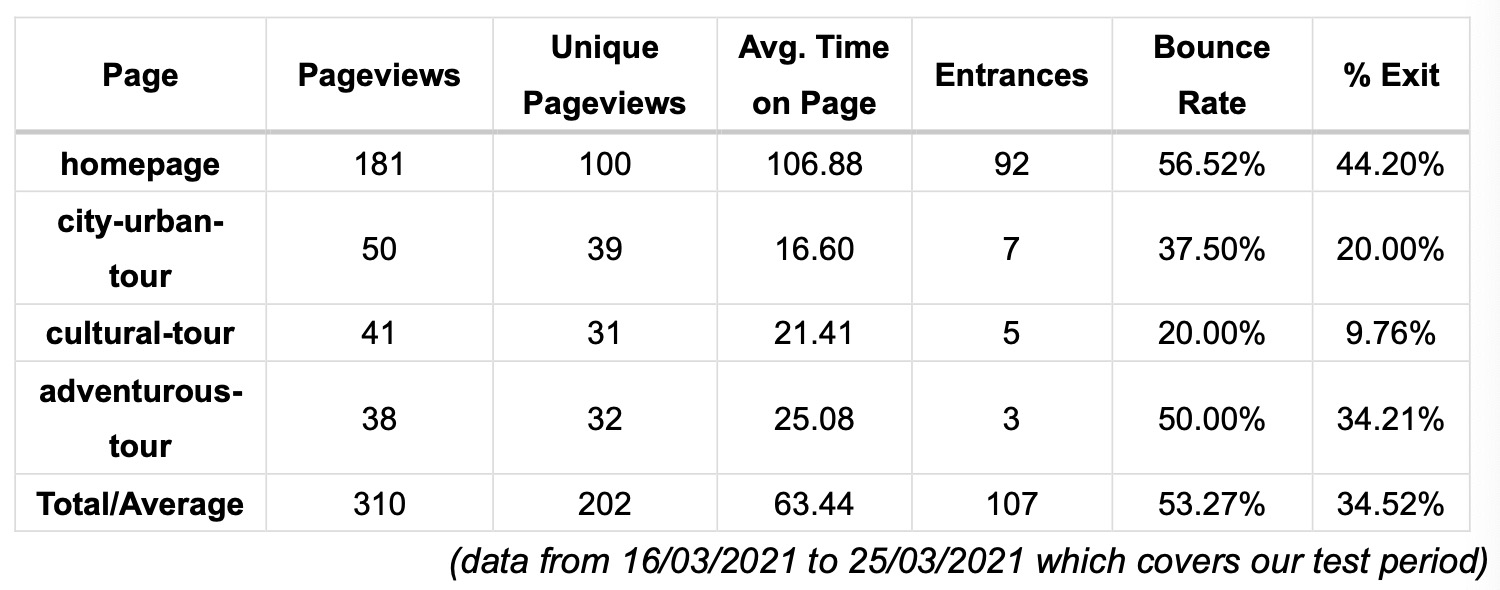
We can see that homepage represents more than 50% of the total pageviews and most visitors enter directly from the homepage. At the same time, visitors spend much longer time on homepage than the time on subpages. These findings can support our OPTION B where we think homepage will be the most viewed page.
Moreover, there are some interesting findings on Bounce Rate and Percentage of Exit. The bounce rate and %Exit of homepage is the highest which means approximately half of our visitors leave our website after visiting the homepage only. So it is better for us to improve the guidance on homepage to our subpages to decrease the bounce rate and %Exit on homepage. In this way, we may improve the CTR.
C.1.2 Geo Analysis
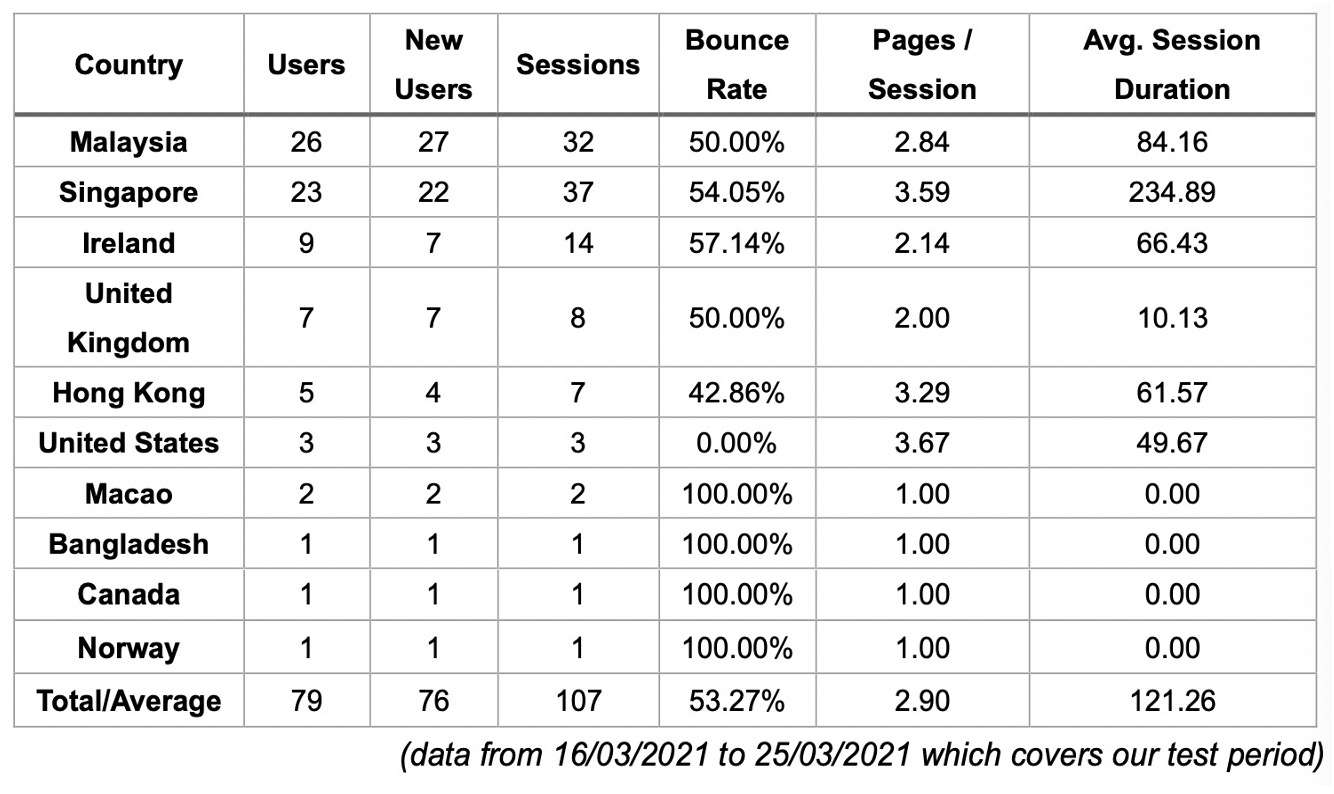
Most of our visitors come from Malaysia, Singapore, Ireland and United Kingdom. This is in line with the way we obtain our sample which is our own connections (friends, colleagues, university cohorts). The average bounce rate is 53.27% and the average pages/Session is 2.9. Visitors from Singapore spend much more time on our website with average session duration of 234.89, which means our products may be most attractive to Singapore visitors.
C.1.2 Device Analysis
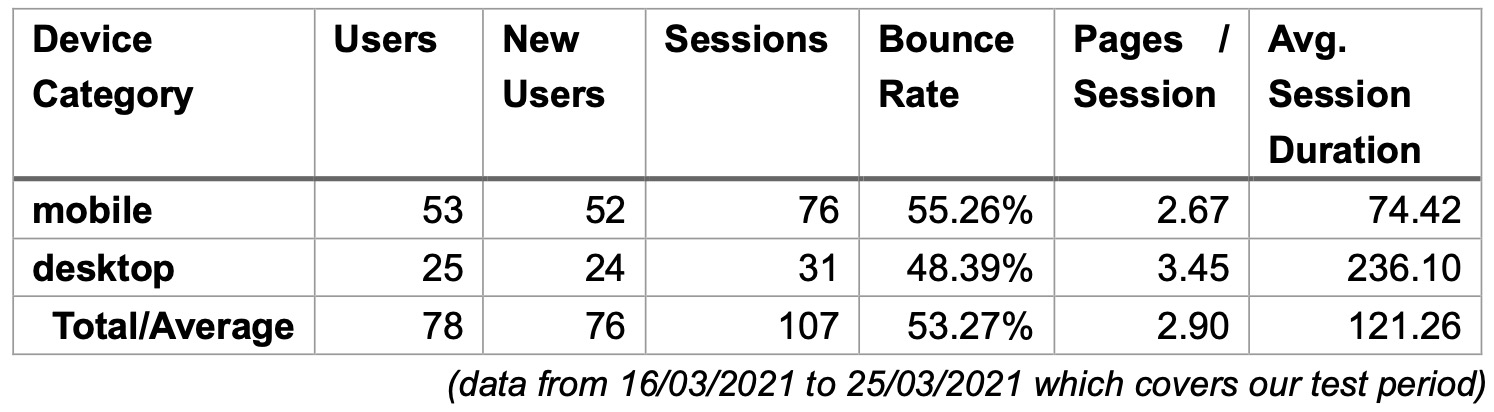
More users visit our website by mobile, while the average session duration is much longer for desktop visitors. One of the reasons is that our website is designed for desktop visitors and looks clear and nice in the desktop version. With such a high proportion of mobile users, a user-friendly website version for mobile users should be developed. Moreover, the difference performance in device category suggests that a deeper analysis in device data should be meaningful.
C.2 A/B test on ‘JOIN US!’ Button with CTR Evaluation
Our A/B test hypothesis is a two-tail test with significance level \(\alpha = 10%\) as followed:
\(H_0:CTR_{OPTION_A}=CTR_{OPTION_B}\)
\(H_1:CTR_{OPTION_A} \neq CTR_{OPTION_B}\)
We can construct a t statistic which is
\(t_{\hat{CTR_A}-\hat{CTR_B}}=\frac{\hat{CTR_A}-\hat{CTR_B}}{se(\hat{CTR_A}-\hat{CTR_B})}=\frac{\hat{CTR_A}-\hat{CTR_A}}{\sqrt{\frac{(n_1-1){s_1}^2+(n_2-1){s_2}^2}{n_1+n_2-2}(\frac{1}{n_1}+\frac{1}{n_2})}}\)
where \(\hat{CTR_A}\) and \(\hat{CTR_B}\) are the mean CTR of the two samples; \(s_1\) and \(s_2\) are the standard deviation of the two samples;\(n_1\) and \(n_2\) are the sample sizes.
| If | t | > critical value 0.1 or \(P-value < \alpha\), we reject \(H_0\). |
Based on the data we collected, we get:
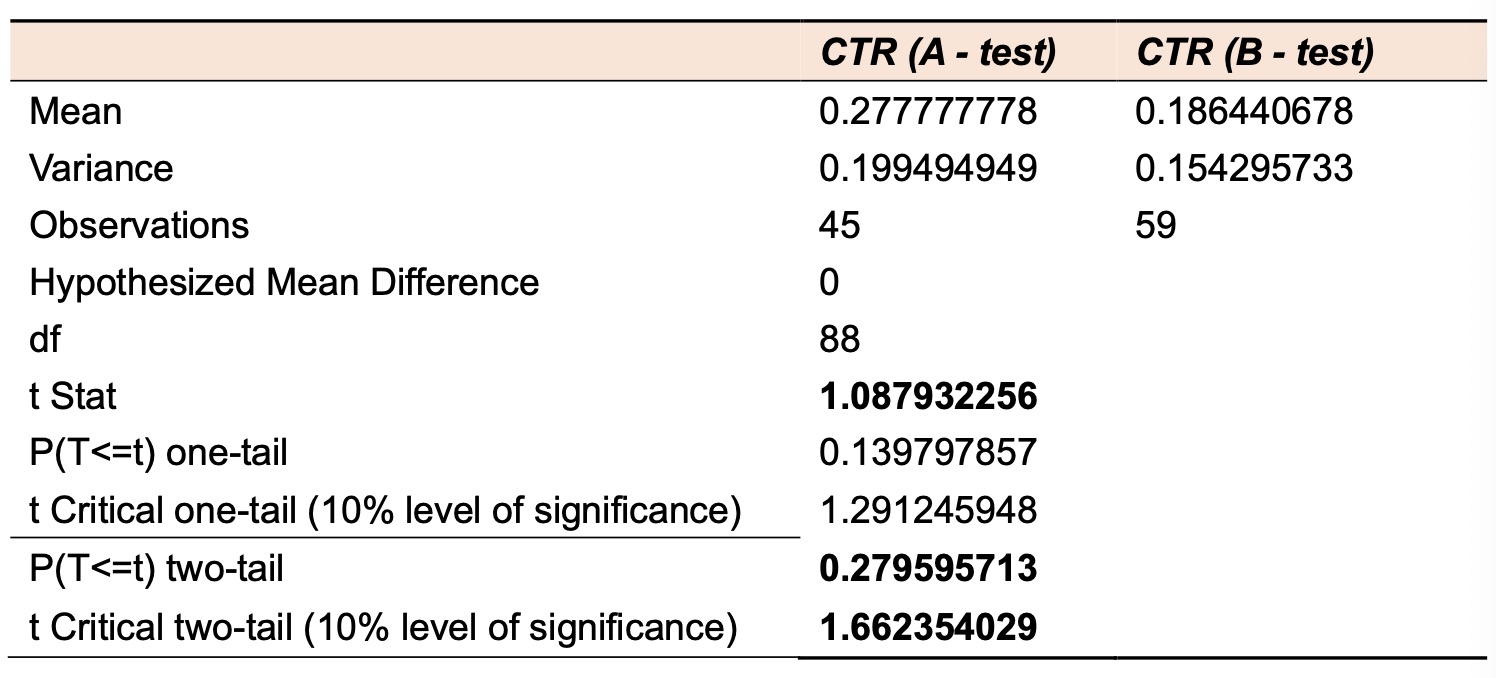
We can see that:
- t stat = 1.0879 < t critical value = 1.6623;
- P-value = 0.2796 > 0.1.
Therefore we fail to reject \(H_0\) at significance level of 10%, which means there is no significant difference between the CTR from OPTION A and OPTION B.
Section D - Further insights & Improvements
Our previous hypothesis result show that there is no significant change in CTR when we shifted our ‘JOIN US!’ button from the subpages to the main landing page of our website. In this section, we would like to delve a deeper into our results to determine if there could be other manipulating factors impacting our test.
D.1 Improvement 1: Separate testing for mobile vs desktop users
Rationale
From our EDA presented earlier, we saw that mobile device users make up >65% of the users to our website. However, desktop users typically spend much more time on our website (session duration on desktop is nearly 3x higher compared mobile). Thus, there is a strong possibility that mobile vs desktop users indeed exhibit different behavior on our website.
In addition, according to our research, more than 20% of consumers will research product/service on their mobile devices before making any purchase. Typical searches include price comparison, product/service review etc. Also, mobile devices are more effective at generating leads which are later converted to purchases made on a desktop/ laptop. Thus, it is important that we understand any behavior differences between mobile and desktop users on our website so that we can then strategies and tailor-made our offering to these 2 groups of users e.g. adopt customized web layout for mobile vs desktop users to drive higher CTR.
Design
With the above rationale and observation in mind, in this section, we will perform a second round of testing. In this round of testing, our hypothesis will remain unchanged, but we will segregate our data according to the user device type (Mobile vs Desktop) before performing our hypothesis test.
Result
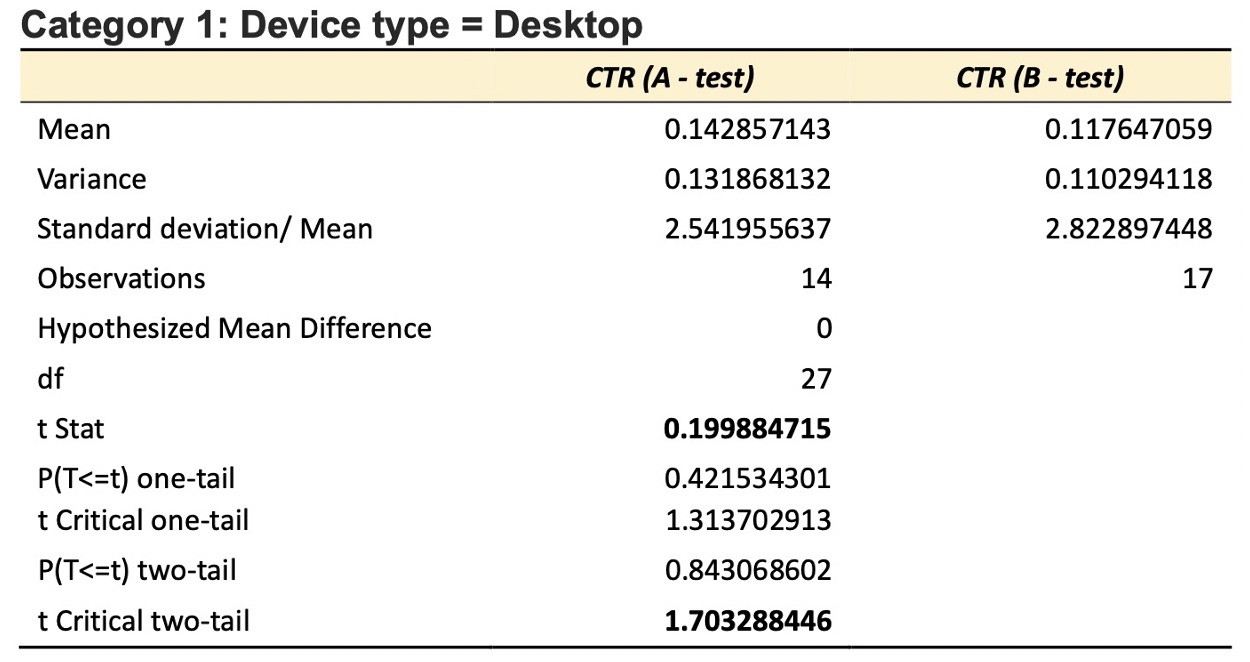
Statistics Comparison
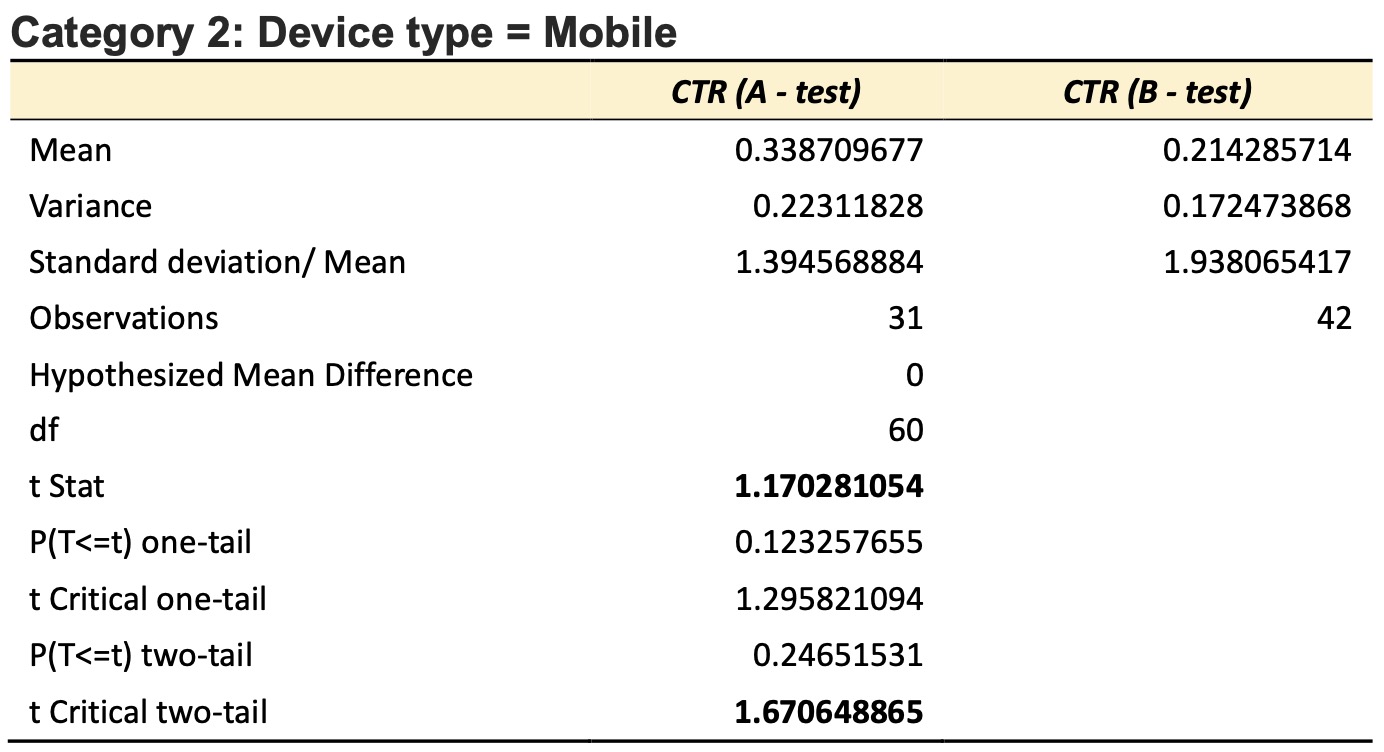
Regardless of test A or B, we saw that our mobile users exhibit a much higher CTR (nearly 2X higher) compared to our desktop users. Additionally, from the lower standard deviation/mean, we can also conclude that the CTR across our mobile users is much more stable compared to the desktop users.
While this result is consistent regardless of the tests, it provided valuable insights on the importance of mobile devices as a primary and relatively stable revenue generator compared to desktop devices. Hence, the management might want to consider more effort and resources to channel mobile users to our websites. (e.g. spend more budget on targeted google ads for our mobile users)
Hypothesis Testing Interpretation
From our hypothesis test results, we saw that at 10% level of significance, t stat < tcritical for both our mobile vs desktop users. Thus, we fail to reject H0 and conclude that the CTR in test B is not significantly different than the CTR in test A.
i.e. At 10% level of significance, for both mobile and desktop users, test B where the ‘Join us’ button is on the main landing page did not result in higher CTR compared to test A where the ‘Join us’ button is on the subpages.
Whilst this result is consistent with the findings in our previous section, we note that t stat is much higher for our mobile users compared to our desktop users. As a blunt comparison, if we had performed our testing at a higher level of significance (e.g. 30%), we would have rejected \(H_0\) in favor of \(H_1\) for our mobile users.
i.e. At higher level of significance, for mobile users only, test B where the ‘Join us’ button is on the main landing page resulted in higher CTR compared to test A where the ‘Join us’ button is on the subpage.
But of course, we note that such result is hardly conclusive and must be interpreted with caution. This is because the number of data points we have now is significantly lower since we selected only a subset of the original data. Hence, for more accurate testing we should in fact tighten and not loosen our test criteria.
Nevertheless, the result of this hypothesis testing suggests that for mobile users in particular, it is possible that our layout in test B fetch a higher CTR compared to that in test A. This is likely because mobile users have shorter session duration and typically utilize their mobile for quick browsing only. Also, mobile users have a higher tendency to look at only the landing page instead of navigating into the subpages. Thus, they are more likely to click on a button on the landing page than a button which is only on the subpages.
Thus, to have a more conclusive result, we should let the experiment run for a longer period, wait for the results to stabilize, converge, and then collect more data before drawing a conclusion. Due to the limited time we have to conduct the experiment, we were not able to collect more data points to draw a more affirmative conclusion that users on mobile devices in fact has a higher CTR in test B. Nevertheless, moving forward, we should delve deeper into this insight to decide if we might need to adopt a potentially different web layout on our mobile device to increase our CTR.
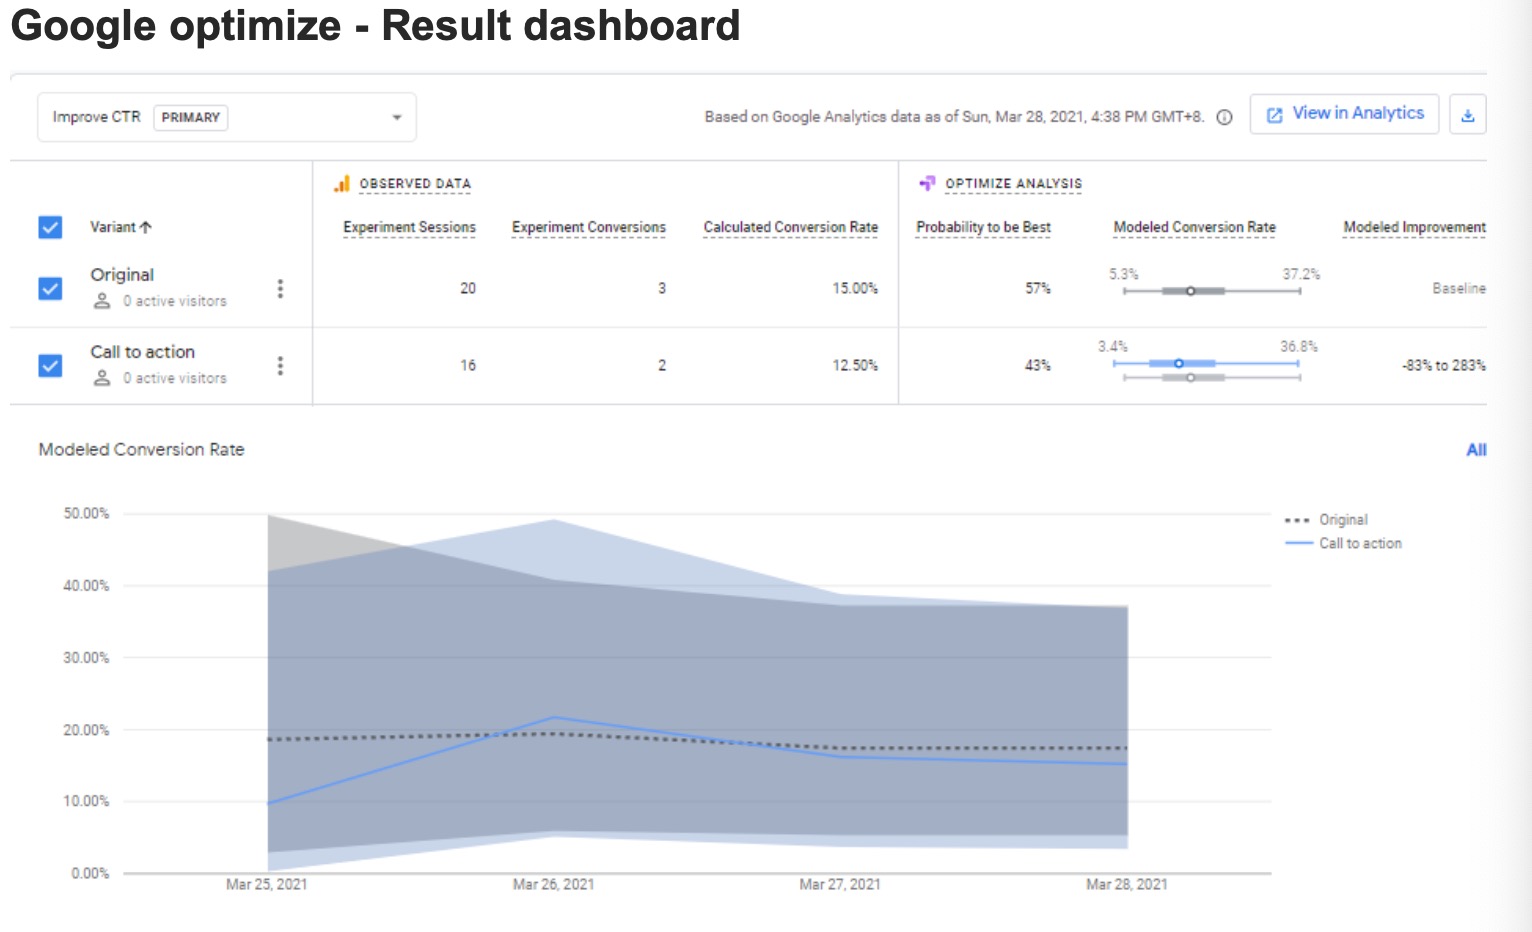
D.2 Improvement 2: A/B testing using Google optimize
Rationale
In our previous experiment, we conducted our A/B testing by running test A’s web layout for a period before switching to test B’s web layout for another period. Although effective, we realise that such deployment might result in the same user being exposed to both layouts in different periods. Hence, it becomes difficult to attribute the effect of each layout on the eventual CTR of such a user.
To overcome this problem, we attempted the Google optimize software which will run both test A & test B over the test period. i.e. 50% of the audience will be exposed to test A and vice versa. Also, each user will be consistently exposed to the same test during the test period.
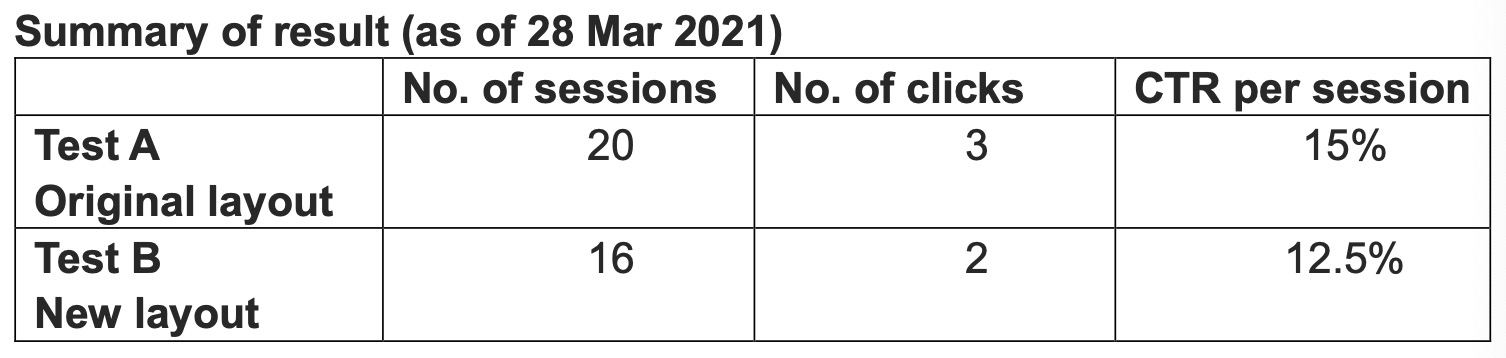
Result
Because our Google optimize testing started only 2 days ago (26 Mar 2021), we have not yet gathered enough data to have a more conclusive result. Although it is tempting to end the test now and draw a conclusion that the original design in test A seems to fetch a higher CTR, this conclusion will be highly flawed due to the very little data points (5 clicks) which we have gathered so far.
As a more prudent approach, we will continue to let the experiment run till the result converge before making any conclusion.
Once we have collected sufficient data, we will then perform another round of hypothesis testing to determine if our design in test A or test B will be more effective in improving our CTR.
Section E - Conclusion and Reflection
E.1 Conclusion
Based on our A/B testing result, we do not see any significant difference between design OPTION A and design OPTION B. Regardless of whether the ‘JOIN US!’ button is placed on the homepage vs subpages, our CTR does not change significantly and we fail to reject our null hypothesis. Extending from this A/B test result, from the business perspective, location of the ‘JOIN US!’ button is not the key to improve the CTR of our website. There could be other factors that may lead to CTR improvement, or limitations in our current test or website design that may impede the CTR evaluation.
Nevertheless, Google Analytics is an easy and low-cost option for us to conduct quick A/B test on our website design. It allows us to generate fast and accurate data for analyzing our digital platforms, so that business decisions could be made faster responding to the marketing effort.
E.2 Limitation and Reflection
(1)Short experiment duration resulting in low test sample size
Due to the short experiment duration, we must be more skeptical of our test results since we are still in the early stages of our experiment. In design the test, we need to consider both test duration and test sample size together. Sufficient test samples have to be acquired or else risking the test biasness. We learned from this A/B test that it is not easy to attract enough volume (acquiring necessary data) to visit a new website despite efforts in promoting it. Moreover, we were not able to collect sufficient sample size per device type (mobile vs desktop) to draw an affirmative conclusion on whether the web layout in test A or B will result in a better CTR. Moving forward, if we could design the experiment for a longer period in acquiring bigger sample size, we would have attained a more stable p-value for a more definitive result. We are equally aware that the test duration should not be stopped with p-value as the only criteria, but a collective considerations on size, duration, stable p-value performance to avoid being misled by early adopters (Overgoor, 2014).
(2)Different user experience in different time periods
Our initial approach of running our test A and test B in different periods resulted in the same user being exposed to both layouts in different periods. Hence, it becomes difficult to attribute the effect of each layout on the eventual CTR of such a user. In retrospect, utilizing tools like the Google optimize will resolve such issues. Hence, moving forward, we should carefully consider such differences in customer experiences before embarking on our experiments.
(3)Choosing the most appropriate performance metric is not very straightforward in practice
There are a number of metrics commonly used in e-commerce, but we encountered a few different situations in practice. We firstly considered
the daily CTR(daily unique clicks/daily unique impressions) but we failed to collect enough sample data due to limited test duration. Then we considered Conversion Rate but we fail to clearly define it with duplicate users in test A & B in our dataset. Finally, we selected
CTR(clicks/sessions) as our metric. Session is the period of time a user is actively engaged with our website, so CTR(clicks/sessions) can help us effectively track and measure users’ behavior on our website.
(4)CTR performance is not dependable on a single tag, but the website content design
In our website, we have only tagged user’s click action to only one button, which is ‘JOIN US!’. This has limited the ability to measure the website interaction with users. Linking the CTR measure to only this button could misled the evaluation of website content attractiveness. For example, a user may find the website interesting, but hesitant to leave his/her contact by clicking the ‘JOIN US!’ button while he/she is still in the consideration stage, and could come back at a later date after exploring. As observed in Section C1 above, the recorded average page view duration is about 63.44 seconds, with sub-pages view recorded below 26 seconds in average. This has pointed to another improvement area where we need to improve the web content, to show more attractive content, i.e. photos, traveling tips, our services to as to retain the session view, as well as designing more interactive tag that allow a user to click, and hence for Google Tag Manager and Google Analytics to capture the data in giving a more comprehensive CTR performance evaluation. This
reflects that a good website content should be well-thought of in the early design stage with the analytics intent in mind so as to not wasting design effort as well as the wasting the data collection potential to improve marketing and business analytics effort.
References
- Overgoor, J. (2014). Experiment at Airbnb. Medium. Available from https://medium.com/airbnb-engineering/experiments-at-airbnb- e2db3abf39e7 [Accessed 3 March 2021]
- Mckinsey (2020) Future of retail operations: Winning in a digital era. Available from: https://www.mckinsey.com/~/media/McKinsey/Industries/Retail/Our%20 Insights/Future%20of%20retail%20operations%20Winning%20in%20a %20digital%20era/McK_Retail-Ops-2020_FullIssue-RGB-hyperlinks- 011620.pdf [Accessed 26 Mar 2021]
- Mckinsey (2013) iConsumers: Life online. Available from: https://www.mckinsey.com/~/media/McKinsey/dotcom/client_service/Hi gh%20Tech/PDFs/TMT_iConsumers_Life_online_2013-01.ashx [Accessed 26 Mar 2021]
Appendix – Hypothesis testing (MS Excel file)
- Appendix 1 – Hypothesis testing
- Appendix 2 – Raw data from Google Analytics