In this project, we had a very exciting firsthand experience of ‘running’ a business. We first design and launch our own website by Weebly, and use tag manager to monitor the site via Google Analytics. Then, we use Google Paid/Keyword Advertising with a budget of £20 to bring visitors to our site. Our goal is to measure the effectiveness of our advertising plan and adjust our decision making through analysing the real data we collect over a few weeks.
The full report contains:
1. Introduction
- Business Context
- Google Ads Campaign Objectives
2. Ads Preparation
- Competitor Analysis
- Google Ads Design
- Bidding Strategy
- Publishing Final Google Ads
3. Ads Effectiveness Analysis
- Summary of Ads Campaign
- Effectiveness of Ads Campaign
- Tracking and Adjustment of Ads Campaign
4. Reflections and Lesson Learnt
1. Introduction
1.1 Business Context
We are a new start-up travel consultancy company, set up by four travelling enthusiasts who like traveling around the globe exploring new places and experience. We are interested to share our great experience with others, hence offering this service to provide customized tour consulting service to customer in curating the personalized tour itinerary, accommodations, logistic planning based on our experience and network across different continents. With the personalized plan offered, customer could save time in doing the tour planning work, grab their luggage, and enjoy the travelling.
We have developed a website TOURSCURATOR4U to showcase our service and as one of the means to spread our business. Our website is structured with a home page and three sub-pages, which reflects our three main offerings:
- City/urban tour
- Cultural tour
- Adventurous tour
At the early launch of our website, we spread the news informing close circle of contacts to visit the website and promote our services. However, visits to the website were limited and new users to the website would depend directly on internal marketing efforts. In order to acquire more traffic to our website as well as to use our website to establish potential customer base (users leaving their contact for our product offering) for a broader international market, we plan to run a new campaign using digital marketing tool like Google Ads.
1.2 Google Ads Campaign Objectives
Google is an indisputable champion of the world’s search engine market. The latest research indicates that Google has acquired 92.41% of the world’s market share (StatCounter, 2021). Google is where people search for what to do, where to go and what to buy. After comparing with other types of advertising, and due to our limited budget (£20 maximum), we decide to use Google Ads (Search Network) for our official website. Our ads have the chance to appear on Google at the moment when someone is looking for products or services like ours. A well-timed advertisement can turn visitors into valuable customers.
In our last round of word-of-mouth campaign, we have 80 visitors in total for 2 weeks. And based on information provided by Google Ads, it estimates that we can have at least 240 clicks for one month which is equivalent to about 60 clicks per week. Considering this information and our business objectives, we are ambitious and expect to double the number of visitors in our last round of campaign. Therefore, our primary target is to acquire 80 new visitors within 1 week(for example, 6 days) by running Google Ads. Since our previous campaign among close circle of contacts were focusing on the four countries of Malaysia, Singapore, Ireland and United Kingdom, we plan to have the Google Ad published to these 4 countries as target market.
In addition, a typical customer’s path to purchase has 3 major steps: Awareness, Evaluation, Decision (Srinivasan, 2016). Thus, for our campaign to be effective, it is important that our marketing effort addresses the customer’s needs at each step of her decision-making process, and more importantly, nudges her positively towards making a purchase. Hence, our Ads campaign aims to let more people know and remember us, indicate our main service, and attract people to click our Ads.

In summary, there are 3 steps we want our customers to accomplish in this Ads campaign:
- Create awareness, i.e., visit & navigate our website
- Generate interest & desire, i.e., like our content
- Catch Attention, i.e., join us by providing their contact information
2. Ads Preparation
Before the design of our ads, let’s look at some important information on how Google Ads works, especially the format of ads and how to win an advertisement position.
First, there are different ways to show ads on Google’s advertising networks, including (i) Google Search Network - advertising in the search results and partner websites; (ii) Google Display Network - visual advertisement by banners on different websites across the web. Considering the aims of this project and our spending budget, we will use Google Search Network to display our ads. Furthermore, Google uses broad match as the default match type in Google Ads. In this way, if someone searches something identical or similar to our selected keywords on Google, our ads will have the chance to appear over or next to the regular (i.e. organic) results.
Second, once our ads are designed and launched, whether they can be shown or not depends on Ad Rank which measures the ranking of our ads on the list of all advertisers who are competing for a particular keyword. Ad Rank is determined by 3 parameters including bid price, quality score and format impact. Bid price plays a key role in the ranking of our ads and is decided through our bidding strategy, while quality score is estimated by Google after evaluating the expected number of clicks(CTR), relevance and landing page quality of our ads. Format impact is not relevant in our case as it is more important in Google Display Network. So our final Ad Rank formula is Ad Rank = Bid * Quality Score.
Based on the above information, aiming to get a higher Ad Rank for our ads, we will start our ads by the following steps:
- gain insight on tourism advertising by competitor analysis;
- design our ads;
- decide our bidding strategy and keywords;
- publish our final ads on Google.
2.1 Competitor Analysis
As a new entrant, we lack information about the tourism industry. And whether our ads can be shown or not is closely related to the strategies of our competitors. By spying on our competitors, we can quickly learn about how competitive this industry is and what ads they have, and thus better make our advertising plan. The focus of our competitor analysis will be in two part, i.e., advertisement design and bidding strategy.

-
Advertisement Design
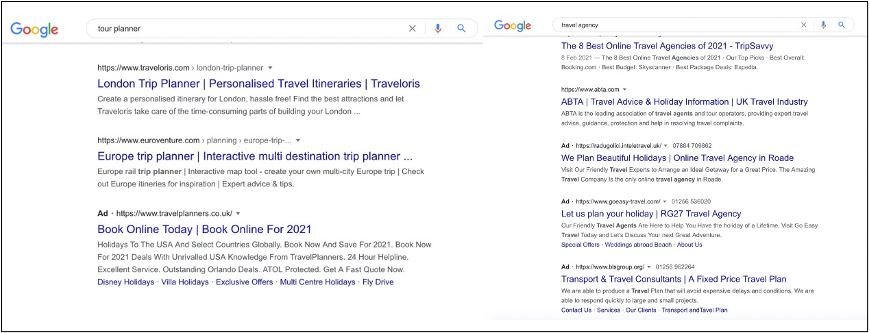
We searched several keywords relating to our business, such as tour planner and travel agency, to see who will be competing with us in Google Ads. We tried the same keyword search in four target countries of our ads, including Singapore, Malaysia, the UK and Ireland.
According to our search results, we find that the advertisement contents from our potential competitors are quite similar in different countries. Most advertisements consist of a brief and clear introduction of the key products followed by an invitation to visiting the websites. In addition, words like ‘free’ and ‘best’ are widely used to attract and motivate visitors.
However, there are still some differences among our target countries and these differences may bring us some ideas on how to improve our ad design and set our bidding strategy in different competition environment. Firstly, when searching ‘tour planner’ in Google, most of the results are shown in ‘trip planner’ or ‘travel planner’ instead in the UK, which means ‘trip’ and ‘travel’ are perhaps more in line with English language habits. (The figure below shows an example of our search results: ‘tour planner’ and ‘travel agency’ searches in Google UK.) Therefore we need to pay attention to the use of words in our ad design, making it more acceptable to our target customers. Secondly, the number of ads shown is different in our target countries. For example, we get more ads displayed in Google UK than in Google Singapore when searching the same keywords. It could be caused by different advertising policies and intensity of competition in these countries.
-
Bidding Strategy
Whether our ads can be shown successfully depends not only on our own bid price but also highly depends on the bidding strategies of our competitors. Understanding competitors’ actions plays a key role in the process of developing our own bidding strategy. There are some tools online to spy on our competitors, such as Auction Insights, SimilarWeb, Ahrefs, SEMRush, etc. (OMG, 2021). Most of these tools need registration and charge for service. Due to our limited budget, we chose SEMRush which specializes in competitor data and provides free trials.
We checked CPC, keyword difficulty, volume and competitive density of a group of keywords in different countries. Values of these indexes show us how our potential competitors compete in the current advertising market and how hard for us to join and win the competition.
Taking keyword ‘Travel Planning’ as an example, the following table presents values of the indexes we mentioned above and the figure below is the screenshots of keyword overview in the UK, Singapore, Malaysia and Ireland.
| Country | CPC($) | Keyword Difficulty | Volume | Competitive Density |
|---|---|---|---|---|
| The UK | 1.83 | 80% | 24000 | 0.37 |
| Singapore | 0.51 | 75% | 140 | 0.25 |
| Malaysia | 0.45 | 66% | 170 | 0.06 |
| Ireland | 1.03 | / | 10 | 0.09 |
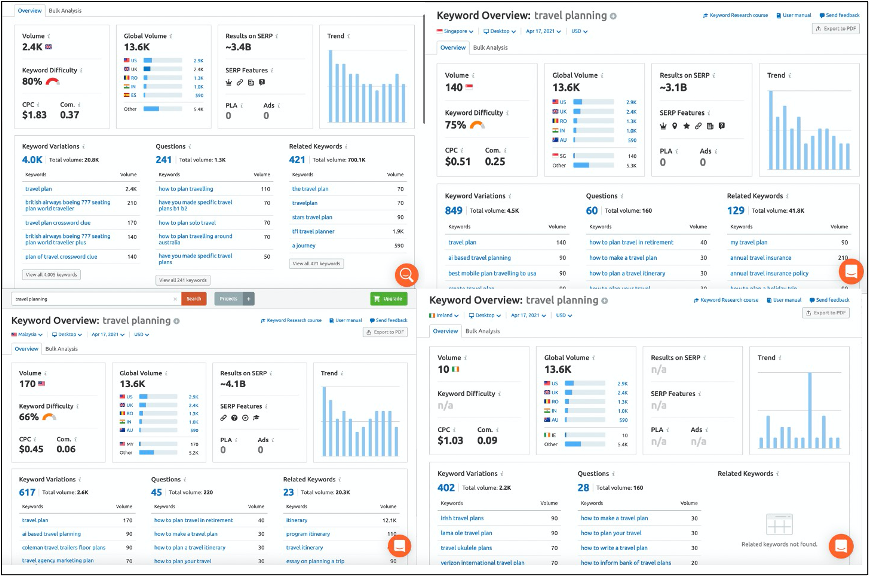
We can see that situation varies in our target countries. The UK market faces the most intensive competition with the highest CPC and competitive density. Our competitors in the UK market pays on average $1.83 for one click on their ads. But the UK is also the largest market among the four countries as it has the biggest volume, which means there are a much greater number of visitors in the UK search for ‘Travel planning’.
A brief summary of average CPC of different keywords in our four target countries is shown below:
| Keyword | Average CPC($) | Average CPC(£) |
|---|---|---|
| Travel planning | 0.96 | 0.69 |
| Travel itinerary planner | 0.74 | 0.53 |
| Travel tips | 0.71 | 0.51 |
| Travel agency | 1.62 | 1.17 |
| Plan your trip | 1.29 | 0.93 |
| Travel consulting | 1.07 | 0.77 |
| City tour | 0.48 | 0.35 |
| Culture tour | 1.05 | 0.76 |
Above all, it will be more efficient if we could differentiate our advertisement design and bidding strategy in different countries. However, due to the limited spending budget and running period of our ads, this time we will simplify the case by only launching the identical advertisement and trying the same bidding strategy in all our target countries.
2.2 Google Ads Design
In addition to what we learn from our competitors about the advertisement design, we also keep in mind two important factors in improving the quality score of our ad, i.e., advertisement relevance and landing page quality.
-
Advertisement Relevance
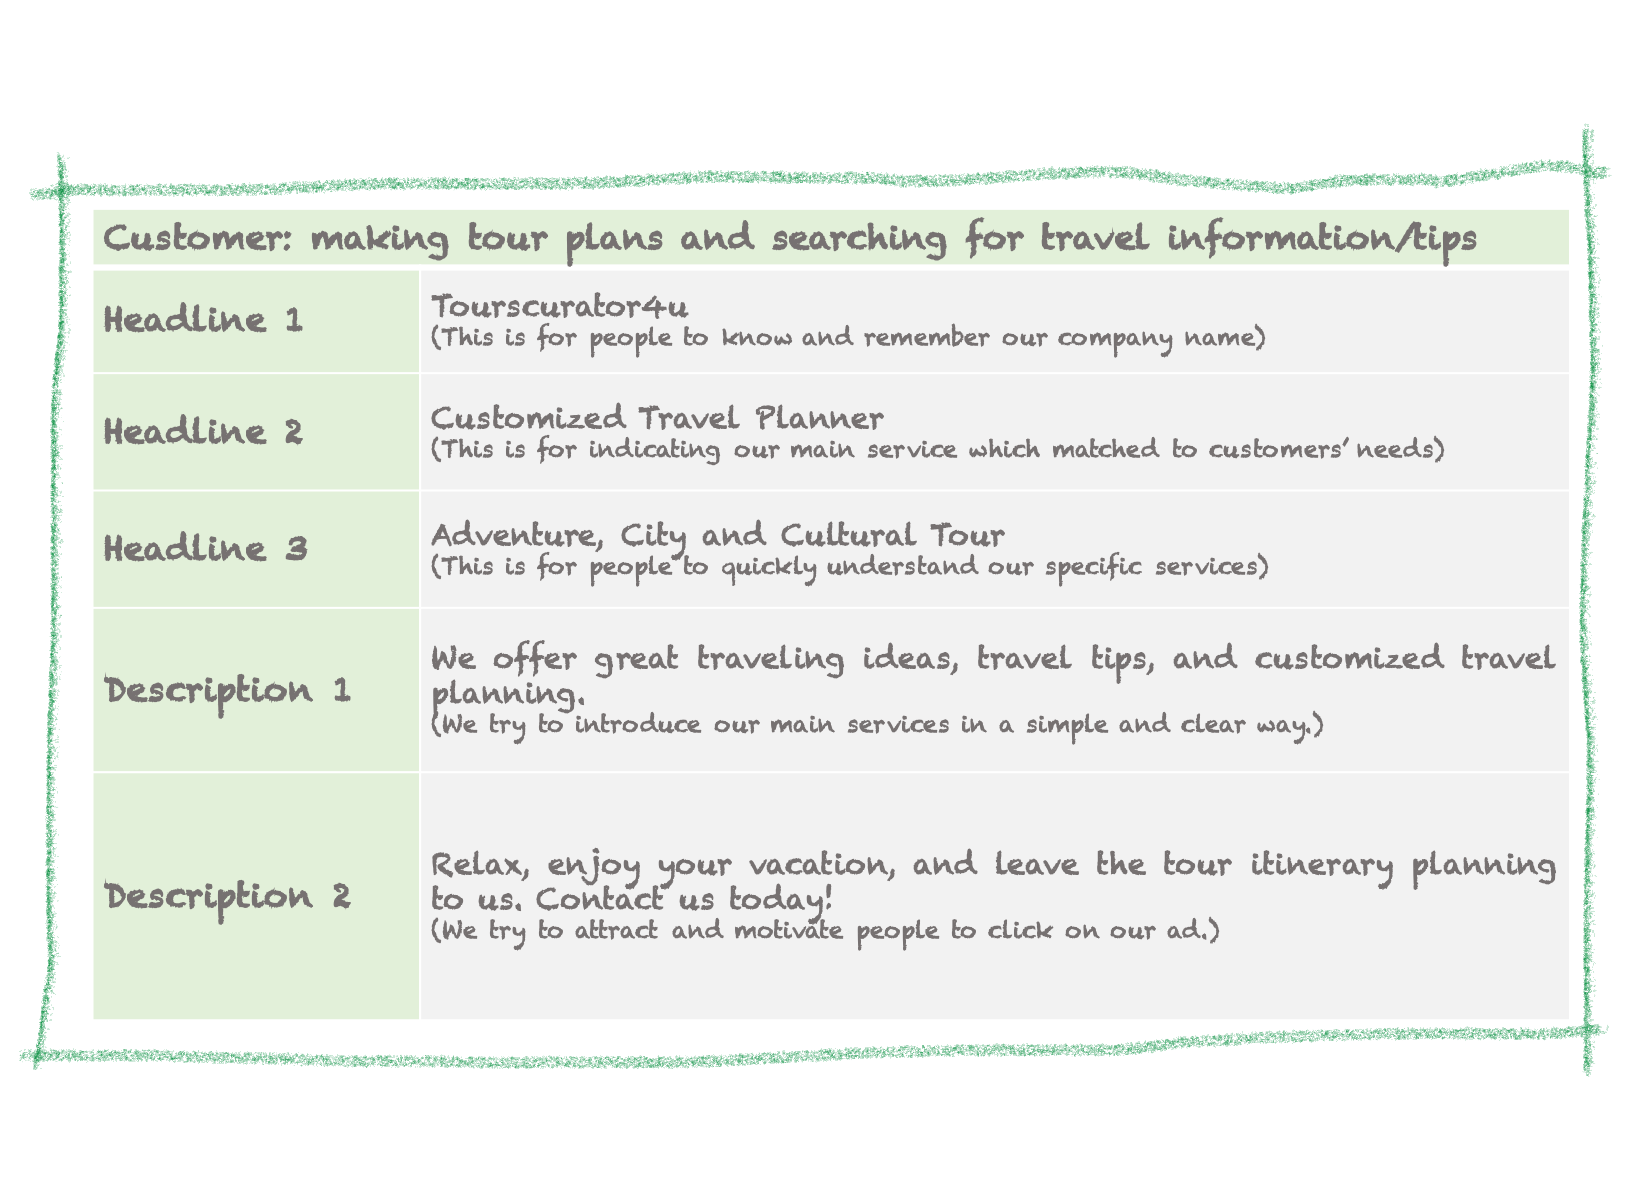
We use a worksheet from Google Ads which is very helpful in letting us better understand our business, goals and customers. By answering three question in the worksheet, i.e., What do I have to offer? What do I want to accomplish? Who are my customers?, we get our advertisement design. The full worksheet is avaible here.
-
Landing Page Quality
After designing our ads, we make some small changes on the homepage of our website to make the guideline clearer. First, we create three new buttons on homepage and each of them is linked to the corresponding subpage. Second, we add a new “Contact Us” subpage and link it to the “Join Us” button on the homepage. All these changes make our website easier to navigate and it is probablely more efficient to direct visitors to our subpages and find out more details.

2.3 Bidding Strategy
Our auction strategy should be set according to our business goal. As we describe in the introduction section, our first and fundamental business goal is to increase the number of website visitors. Therefore, cost-per-click (CPC) will be an appropriate metric to use in our bidding strategy.
We have checked the average CPC for a group of keywords in our competitor analysis. Among these keywords, we decide to use three of them, which are Travel Planning, Travel Itinerary Planner and Travel Tips. These three keywords have relatively lower average CPC and they are very well matched with our services as well as what we put in our ads. In addition, we add another keyword which is Customized Travel Planner. We fail to find competitors information on this keyword, but we think this one highlights one of our key selling points which is ‘customized’, and it is more specific so that it may not be as competitive as the other three keywords.
| Keyword | Average CPC($) | Average CPC(£) |
|---|---|---|
| Travel planning | 0.96 | 0.69 |
| Travel itinerary planner | 0.74 | 0.53 |
| Travel tips | 0.71 | 0.51 |
| Customized travel planner | / | / |
| Average | 0.8 | 0.58 |
Another important thing to consider is that our bidding strategy is capped by our spending budget which is £20. Combining this constraint with our business objective(acquiring 80 new visitors for 6 days), the whole bidding strategy becomes:
- Spending budget = £20
- Expected Ad running time = 6 days
- Objective = 80 new visitors(clicks) during ad running time
- Expected Clicks per day = 80/6 ≈ 13.3
- Expected CPC = £20/80 = £0.25 per click
- Expected Daily Average Spend = Expected CPC * Expected Clicks per day 0.25*13.3 = £3.325
In conclusion, our first bidding strategy will be setting four keywords, which are Travel Planning, Travel Itinerary Planner, Travel Tips and Customized Travel Planner, with a daily average spending of £3.30. It is noticed that our expected CPC is relatively lower than the average CPC of our competitors (£0.25 < £0.58), which is mainly due to our small spending budget and the lower expected value one click brings to us. We will try this low expected CPC first and adjust our bidding strategy according to the real situation.
2.4 Publishing Final Google Ads
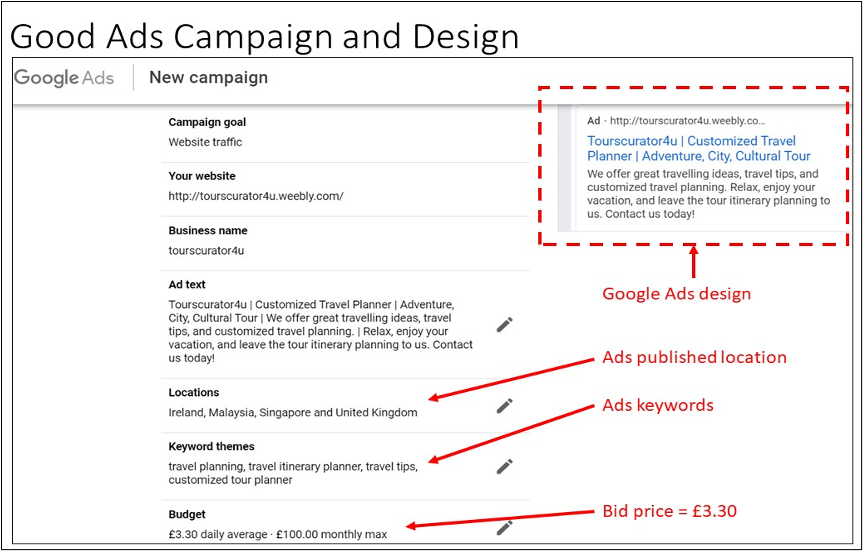
The following diagram shows the final Google Ads design and bid price used for our digital marketing campaign, using Google Ads. Our designed advertisement go live on 10th April 2021.
3. Ads Effectiveness Analysis
3.1 Summary of Ads Campaign
Our Google Ads campaign ran for 4 days (instead of 6 days) from 10th April 2021 (Saturday morning) to 14th April 2021 (Wednesday morning). The following figure contains the screenshots of keyword searching by Google search engine on the four keywords we selected on Day-1 of the campaign, where our advertisement appears in the search results. With the bid price of £3.30 when our advertisement go live on 10th April 2021, our ad is seen placed at either second top, or bottom first in keyword searching results from Malaysia, Singapore, Ireland, and the United Kingdom.
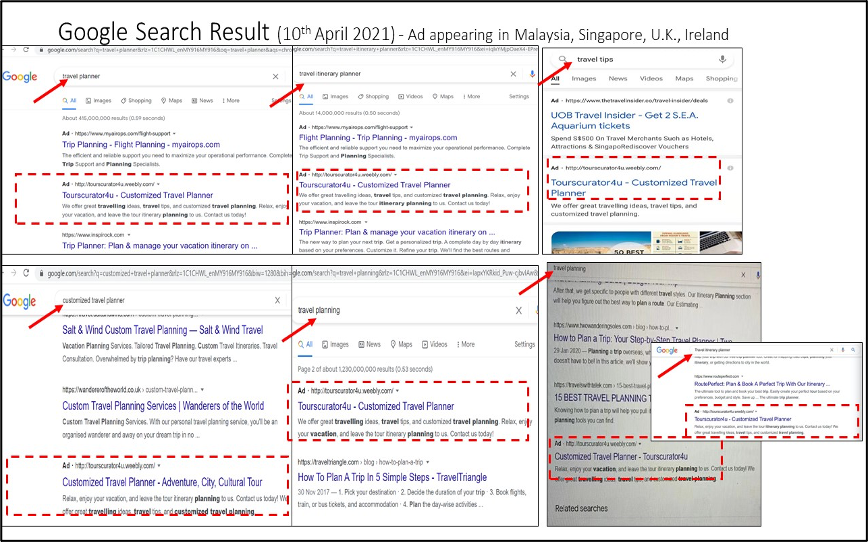
The Google Ads campaign dashboard on 14th April 2021 when the campaign stopped is shown below:

The Google Ads campaign summary is as followed:
| Campaign duration | 4 days (4.52a.m., 10th April 2021 ~ 9.30a.m. 14th April 2021) |
| Total impressions | 7,720 |
| Total clicks | 101 |
| Total users | 74 |
| Total sessions | 84 |
| Bounce rate | 75% |
| Page per session | 1.67 |
| Click through rate | 1.31% |
| Total conversions (click on page “Contact Us”) | 5 |
| Cost per Click | £0.14 ($0.19) |
| Total spent | £14.26 ($19.60) |
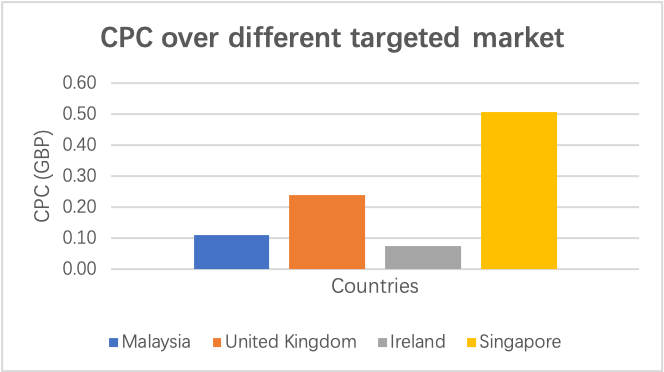
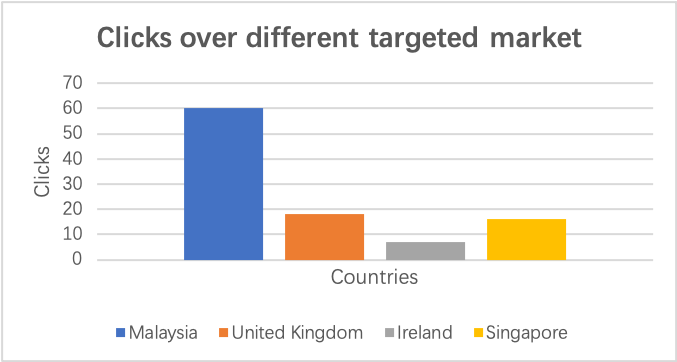
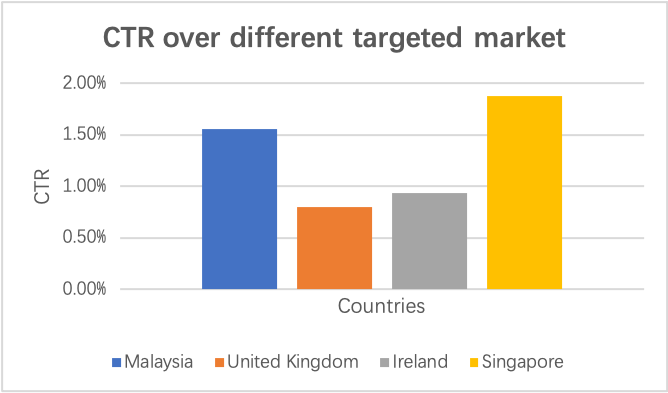
The following three figures show CPC, number of clicks and click through rate respectively over the four different targeted countries:
Before we delve into our analysis on the data, we perform a quick EDA and observe the following:
- Traffic type:
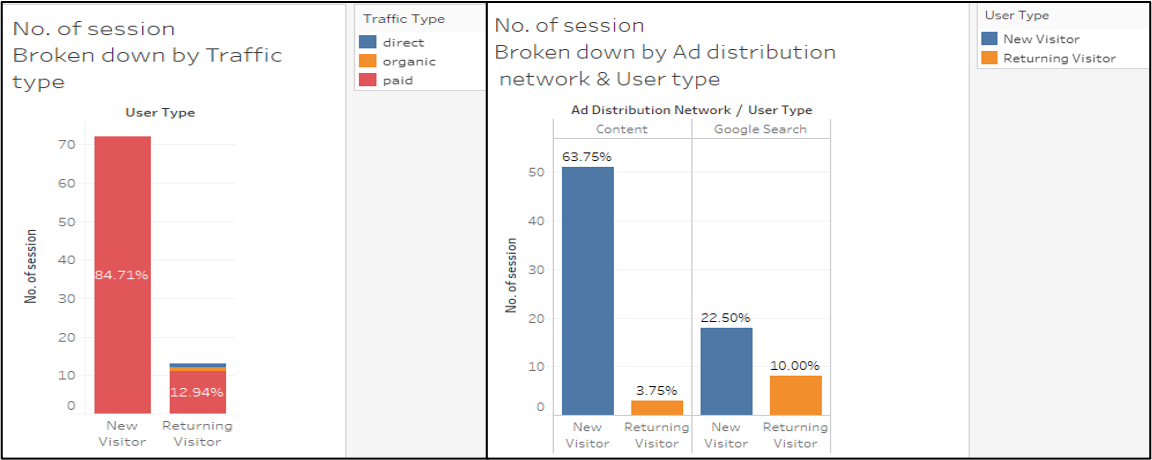
Out of the 84 session visits we received, only 1 was triggered from organic search and 1 due to direct entry of our website. The rest of the traffic all came from paid search advertising. This is as expected as we are a very new brand with no track record and brand exposure. Thus, it is unlikely that potential customers will enter our website directly. Moreover, with limited experience in SEO to optimize our web, it is unlikely that our new brand will be featured highly in an organic search. Hence, in our analysis, we will remove the traffic from organic search and direct website entry. We will focus instead on the traffic from paid search advertising.
-
Ad distribution network:
Our main ad distribution network are Google search (~30%) and Content network (~70%), also known as Google Adsense (this network is selected by default in any Google Ads campaign). With Content network, our ad runs against related web content. Based on our research (Wordstream, 2021), we expect users brought in from Content network (where users were on pages loosely related to our website) to be much more passive compared to those from Google search (where users were actively searching for keywords related to our website). We will delve deeper and verify this hypothesis in our analysis below. -
User type:
Over the course of our experiment, our website attracted both new (87%) and return users (13%). Compared to new users, we expect return users to be much more engaged and interested in our services. We will delve deeper and verify this hypothesis in our analysis below.
3.2 Effectiveness of Ads Campaign
We will use the following metrics to measure the effectiveness of our campaign in each major step of the customer’s path to purchase:

-
Effectiveness of our ad at Stage 1: Cognitive stage
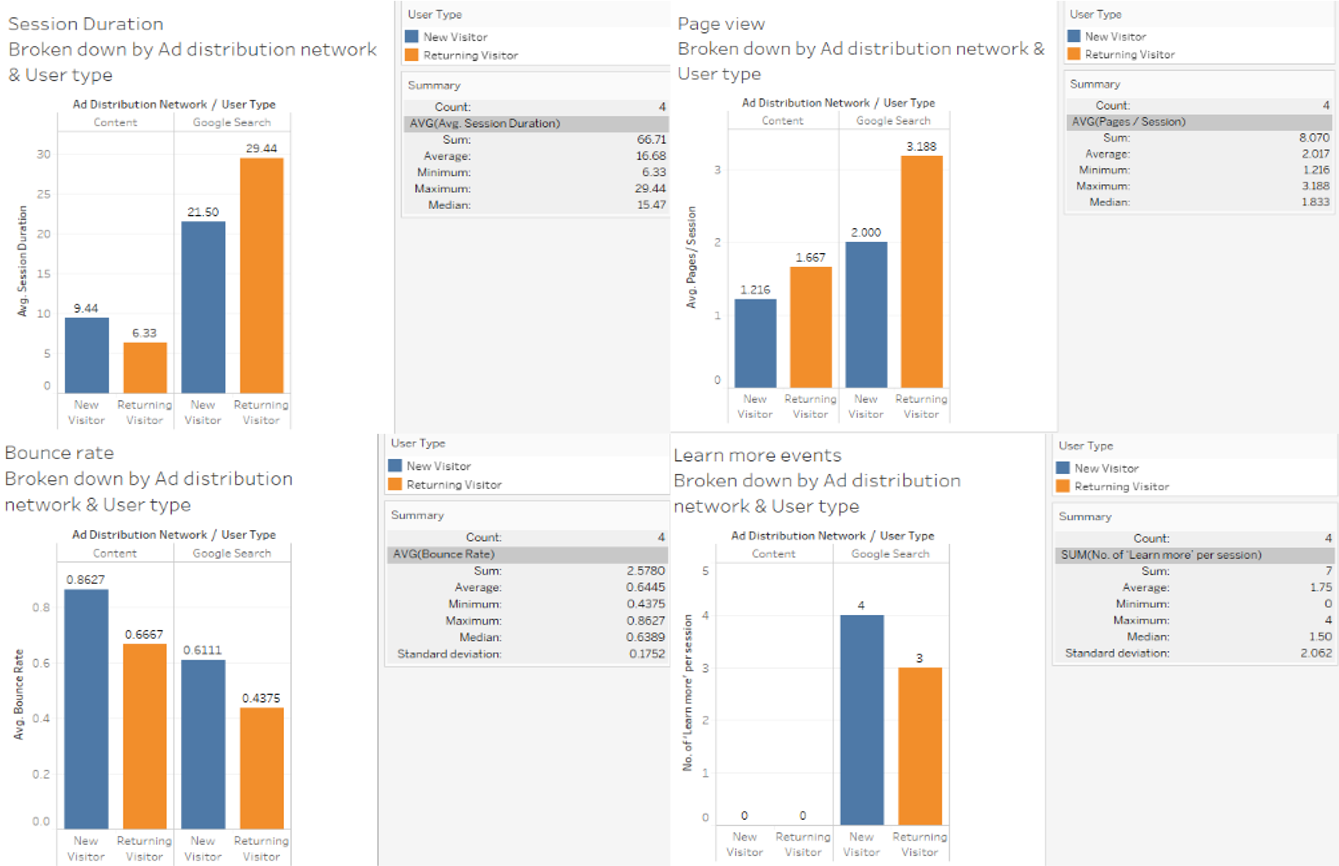
Only traffic brought in by Google search eventually clicks on the ‘Learn more’ button to find out more about our services. In addition, all other performance metrics (Session duration, Average page view per session, Bounce rate) are much better for traffic brought in via Google search than Content network. In fact, average session duration, number of page view per session were nearly 2 times higher. Such metrics likely translate to much more interest and higher brand awareness. Also, return users not only have lower bounce rate but also show much better performance metrics compared to new user. This is expected since such users likely return due to a previous good experience and are thus keen to explore our services further.
-
Effectiveness of our ad at Stage 2: Affective stage - Like our content
Only traffic brought in by ‘Google search’ likes our pages. Also, we see that more than 40% of the traffic from Google search returns to our website while less than 6% of the traffic from Content network do so. This is aligned with our previous hypothesis that traffic from Content network is generally more passive as they are shown our ad most likely due to a loosely similar content they are browsing on. On the other hand, traffic from Google search is more likely to be active users searching for topics aligned to keywords we advertise. This is further reinforced by the fact that only traffic brought in by Google search likes our pages.

-
Effectiveness of our ad at Stage 3: Behavioral stage - Join us
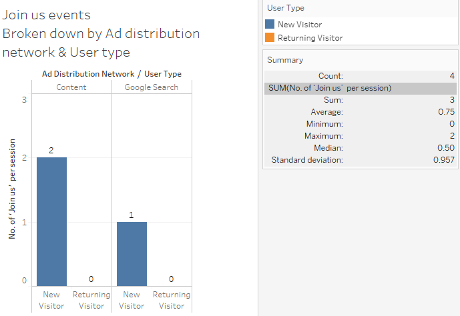
During our experiment period, we have 5 clicks on the contact us page and only 3 visitors click on the ‘Join us’ button for users to send us their contact details. Hence, we are not able to draw much insights on the influence of our ad on the conversion rate with such limited data.
In summary, as a new company, there is huge potential for us to improve our brand awareness which is an important building block that can eventually lead to sales conversion. In view of this, it is positive that Google search ad improves traffic to our site and leads to more upper funnel activities. With more than 40% of the visitors returning to our site, this is possibly a good sign that the brand awareness brought by Google search ad is sticky. Moving forward, we can further conduct experiments to determine how we can turn this brand awareness into sales conversions, e.g., with better service differentiation etc. Moreover, we note that compared to traffic from Content network, traffic from Google search shows much higher average session duration, average page view per session, return rate and lower bounce rate. This further confirms our hypothesis that traffic from Google search is more engaged compared to traffic form Content network. However, such paid search advertising alone does not seem effective in improving our conversion rate. In fact, we received only 5 conversions over the period of our experiment. Moreover, the effectiveness of the advertisement on brand consideration cannot be quantified due to the low number of ‘likes’ events.
3.3 Tracking and Adjustment of Ads Campaign
We monitor the Ad performance every 12-hour through Google Ads and Google Analytics. On Day-2 evening(the 4th round of tracking), we have 26 clicks on our ad from 447 impressions, amounting to £9.12 total spent which is approximately £0.35 per click (we estimate £0.25 per click). The cost spent is higher than what we estimate. Thus, we change the strategy to lower our bid-price by 25% from £3.30 to £2.48 so that we could have enough budget for the remaining 4 days. Meanwhile, we drop two keywords which are “Travel Planning” and “Customized Travel Planner”, as a result from the evaluation of the effectiveness of our keywords on Day-1 and Day-2. We find these two keywords have only one search record each, returning a high Cost-per-Click compared with other keywords.
On Day-3 morning (the 5th round of tracking), there are 35 clicks and 2 conversions recorded. It means 9 clicks are added after the price revision. A total of £11.05 is spent so far. Again, to control our budget, we decide to reduce the bid price by 20% to £1.98 (this is equivalent to 40% reduction from 1st bid price of £3.30), taking into considerations of the following:
- 55% of our budget (£20) is spend till Day-3 morning, with £8.95 left for another 4-day campaign.
- Cost-per-Click is £0.315, which is still higher than our initial budgeted bid price of £0.25.
- Minimum budget of £1.32 as required by Google Ads.
- Using a different bid price to test Ad-Rank.
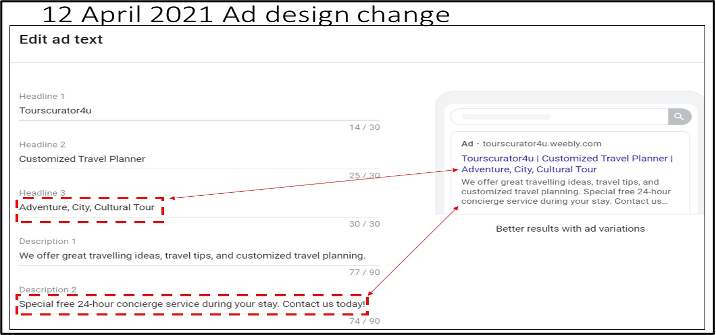
On the Day-3 evening (the 6th round of tracking), we notice the total number of impressions increases in spite of the bid price reduction. It means our ad still appears in Google search result, and our bid price still beats our competitors’ prices. However, there is no change in the number of clicks. Instead reducing the bid price again, we try another way to improve our ad campaign which is modifying our advertisement design as followed to make it more attractive.
Tracking was continued on the following days without change. Till 14th April 2021 (Day-5) morning, the ad has received 7720 impressions, 101 clicks and 5 conversions, with a total spending of £14.20. Although we do not exceeded budget, we decide to stop the campaign due to the following reasons:
- High number of clicks (101) received in 4-day of campaign, far exceeding our initial target of 80 clicks within a week.
- The ad campaign returns with low conversions, with only 5 records. If we keep the ad running to complete the 6-day ad campaign, we are doubtful whether the conversion recorded would go beyond 10.
The following table summarizes the tracking and adjustment made throughout the campaign:
| Date | Tracking Round | Bid Price | Change / Adjustment |
|---|---|---|---|
| Day-1: 10th April 2021 | - | £3.30 | Campaign went live at 4.52 a.m. |
| Day-1: 10th April 2021 | 1 | £3.30 | |
| Day-1: 10th April 2021 | 2 | £3.30 | |
| Day-2: 11th April 2021 | 3 | £2.48 | Bid price reduced 25% to £2.48 |
| Day-2: 11th April 2021 | 4 | £2.48 | Ad design changed. Dropped keywords “travel planning”, “customized travel planner”. Modified ad descriptions. |
| Day-3: 12th April 2021 | 5 | £1.98 | Bid price reduced 20% to £1.98 |
| Day-3: 12th April 2021 | 6 | £1.98 | |
| Day-4: 13th April 2021 | 7 | £1.98 | |
| Day-4: 13th April 2021 | 8 | £1.98 | |
| Day-5: 14th April 2021 | 9 | £1.98 | Campaign stopped |
4. Reflections and Lesson Learnt
-
Bid pricing strategy and competitor analysis
The initial bid price was set at £3.30, considering the cost-per-click information available from online competitor ‘spying’ tool SEMRush, as well as our historical click-through-rate and our spending budget. We set the bid price lower than the average bid price of competitors on Day-1 to test the search result, with expectation to raise the bid price higher when time progress to get to the right bid price. However, our initial strategy did not work, and we managed to have our ad published and appeared within top-two rank right from the beginning. Even though we had reduced 40% from the initial bid price to £1.98, our ads were still ranked either the second top or bottom first sometimes.
Our bid price strategy was influenced by the price range bar in Google Ads where the range started at £2 and went up to £9, with £3 as the default recommended price from Google Ads. Therefore setting £3.30 as the first bid price is reasonable, beating the recommended £3 price, and it was close to our own calculation. The second adjustment (£2.48) was made to be above £2, taking 25% reduction, and the final adjustment was made to be slightly below £2 (£1.98). All our bid prices put in were below competitors range from SEMRush, yet we could still have our ad appeared. This points to the two unknown factors in determining Ad-Rank: (i) website and ad quality of our competitors, i.e. their click-through-rate, and (ii) their bid price.
What we learned, the bar range in Google Ads and the online tool information gave the range and the average value of competitors’ CPC. An ad could go to the top if the bid price is low, yet commands a very high landing page quality (or CTR). In addition, having the ad published in four different countries made the bid price difficult. The bid price offered could be low for countries like the UK due to market competition, but still a good bid to hit a high Ad-Rank in another country like Malaysia, or Singapore. Price determination of the ad should have considered which target market could turn in more customers, rather than setting one price for all. Else, different ad campaign (and bid price) for different market should have been designed to avoid this complication. This is evident from the dicussions in section 3 above, where different countries have a different CPC and CTR.
-
Ad campaign performance monitoring
From the above learning on bid price and adjustment made throughout the campaign, it is important for us to track the ad campaign performance closely so that we can evaluate and adjust the pricing strategy accordingly. We had set two times of monitoring per day (approximately 12-hour interval) looking into Google Ads and Google Analytics dashboard, since we had planned for a short 6-day campaign period with a tight budget. With the close monitoring of ad performance, we were able to adjust our bid price and ad design progressively.
We had our monitoring planned and done at 8.30 a.m. ~ 10.30 a.m. and 8.30 p.m. 10.30 p.m., considering that the ad campaign were published at Malaysia, Singapore, Ireland, U.K. with 8-hour difference. Looking at the users’ click behavior extracted from Google Analytics below, our monitoring could be timed in a different way, perhaps 3 times a day, with one in the morning 8.30 a.m. ~ 10.30 a.m., and another two in the evening, 5.00 p.m. ~ 7.00 p.m. and 10.00 pm.~ 11.00 p.m.

Then, we could have taken the advantage of digital marketing of having the real-time performance to have the marketing strategy (i.e. bid price, ad design, target market) evaluated more responsively to the campaign performance, by considering the users’ click trend, remaining budget value, CPC, keywords search performance and target market.
Looking into the trending of clicks and CPC over the period, as shown below, we can see that the CPC is trending down after bid price adjustment as the ad is still receiving increasing clicks over the campaign period.
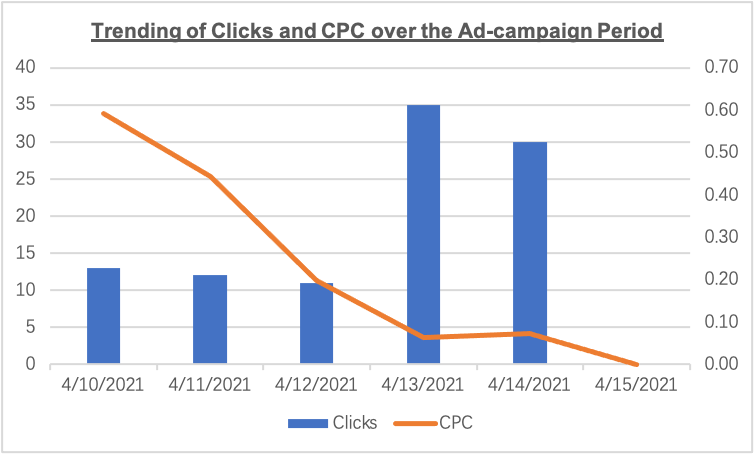
If we have monitor the ad performance in a timely manner, looking into the detail of analytics instead of the default dashboard (the default dashboard in Google Ads shows number of impressions, clicks, total spend, and conversion), or if we have a purposely-built performance dashboard for monitoring, we could have adjusted the bid price earlier, and thus pressing the the CPC curve flatter and sooner.
-
Google Search vs. Content Network
From our previous analysis, traffic brought in by Content network has much lower performance metric compared to traffic from Google search. This is likely due to the more passive nature of the traffic from Content network. Moreover, by having traffic from both Content network & Google search, it is tough for us to finetune our Google ad parameters. As seen in the graph below, when we first dropped our bid price and introduced new keywords on 11 Apr, the traffic from Content network & Google search started trending in opposite directions.
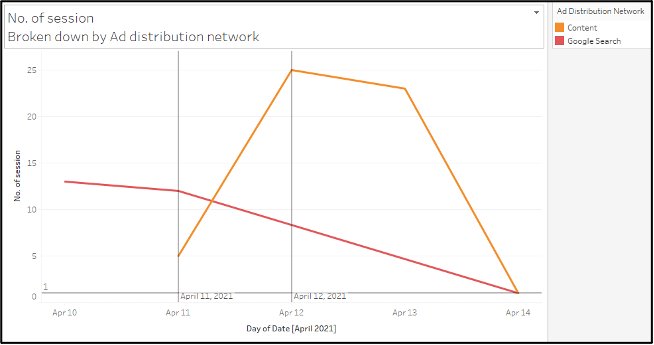
Hence, in the absence of a bigger budget to understand the different drivers behind the traffic from Google search vs Content network, we should consider turning off the traffic from Content network and instead focus on traffic from Google search which has performed better so far.
-
Website quality
We achieved initial ad campaign objective of getting 80 clicks (or 80 users) and spent within budget, but we had not able to ‘convert’ enough users as there were only 5 users who clicked on the “Contact Us” page, 3 users who clicked on the “Join Us” button, and 0 user had left their contact with us. Contrary to the previous campaign by word-of-mouth to close friends and network, the paid ad-campaign has performed poorly although the website received more session views through paid ad-campaign.
Marketing through word-of-mouth and close contact recommendation would return a higher success probably due to the trust factor. Getting a stranger to leave their contact with us would be an uphill task unless the offer from the website is attractive and convincing enough to woo the users, turning their consideration into a likely purchase. To achieve this, an improved website design with a more professional service outlook will be needed, for example, introduction of the business management team, business contact information, attractive travel itinerary offering, complementary notes from customers.
Reference
- OMG, (2021) Google Ads Secrets: How to Spy on Competitors Adwords Edition. Available from: https://www.onlinemarketinggurus.com.au/blog/google-adwords-competitor-analysis.
- Srinivasan, S., Rutz, O., Pauwels, K. (2016). “Paths to and off purchase: Quantifying the impact of traditional marketing and online consumer activity”. Journal of the Academy of Marketing Science. 44 (4), 440-453
- StatCounter, (2021). statcounter GlobalStats: Search Engine Market Share Worldwide. Available from: https://gs.statcounter.com/search-engine-market-share.
- WordStream, (2021) Content Network - Contextual Advertising Tips & Best Practices. Available from: https://www.wordstream.com/content-network#:~:text=A%20content%20network%20is%20a,Google%20AdWords%20allows%20contextual%20advertising.
Appendices
- Appendix 1 – Worksheet: 3 questions to ask when writing your ad
- Appendix 2 – Raw data from Google Analytics
